Research Article
Scenario Analysis on Operation Efficiency for Waste Collection and Transport: A Case Study in Da Nang City, Vietnam
Dang NH1, Le Thi Tuong Vi2, Tran Vu Chi Mai 1 and Yasuhiro Matsui1*
1Graduate School of Environmental and Life Science, Okayama University, Okayama, Japan
2Greenworld Environmental Technology Corporation, Ho Chi Minh city, Vietnam
Corresponding author: Yasuhiro Matsui, Graduate School of Environmental and Life Science, Okayama University, Okayama, Japan, Tel/Fax: +81 86-251-8991; E-mail: matsui@okayama-u.ac.jp
Citation: Dang NH, Vi LTT, Mai TVC, Matsui Y. Scenario Analysis on Operation Efficiency for Waste Collection and Transport: A Case Study in Da Nang City, Vietnam. J Environ Soc Sci. 2018;5(1): 134.
Copyright ©2018 Dang NH, et al. This is an open access article distributed under the Creative Commons Attribution License, which permits unrestricted use, distribution, and reproduction in any medium, provided the original work is properly cited.
Journal of Environmental and Social Sciences | Volume: 5, Issue: 1
Submission:27/12/2017; Accepted: 09/01/2018; Published: 12/01/2018
Abstract
The authors focused on the major alternatives towaste collection and transport practices used in Da Nang city. GPS devices and a GIS software were usedto survey andanalyze the detailed tracking data on 3 currentpractices; “Door-to-door collection by tricycle and transport by truck”, “Door-to-door collection and transport by truck”, and “Fixed time dustbin collection and transport by truck”. The operation efficiency indicators, such as unit operation time, person-hours/t and operation velocity were calculated usingadetailed operation category: moving forward and backward, waste collection waste, unloading and other activities. Usingmulti-regression analysis, the authors estimated the unit loading time and the unit waste amount for 4 types of containers, 240-L dustbin, 280-L dustbin, 660-L dustbin and Handcart.
Using scenario analysis in Hoa Cuong Nam ward in the Hai Chau district, the operation efficiency of “Door-to-door collection by was 4.39 person-hours/t, which was lowest among the current 3 practices, and that of “Door-to-door collection and transport by truck” was 3.70 person-hours/t. “Fixed time dustbin collection and transport by truck” achieved the highest efficiency of 2.15 person-hours, which was less than half of “Door-to-door collection and transport by truck”. The operation efficiency of a separate collection of bio-waste by plastic bag was 3.49 person-hours/t. It was better than thedoor-to-door collection scenarios, which means it would be a feasible alternative that can replace door-to-door collection practices.
The authors also conducted sensitivity analysis to clarify the impacts of policy factors such as truck capacity, collection frequency, and separation rate of bio-waste. The variation range of efficiency by collection frequency was larger than the range by truck capacity. The authors also found some conditions for the separate collection of bio-waste by plastic bag with better efficiencies than “Fixed time dustbin collection and transport by truck”, e.g., “7 times per week for bio-waste and once per week for other waste”. The variation range of efficiency by separation rate was largest among the influence factors considered in this study.
Keywords:
Waste collection and transport; Operation efficiency; GPS; GIS; Scenario estimation; Sensitivity analysis; Person-hour
Introduction
In developing countries including Vietnam, the volume of solid waste has been increasing in recent years with the rapid growth of economics and population. The amount of domestic waste generated from urban areas in Vietnam was 17,682 tons/din 2007 and 26,224 tons/din 2010. This represents an average increase of 10% per year in the 2007-2010 period. This amount continued to increase to 32,000 tons/din 2014, which showed an average yearly increase of 12% during the 2010-2014 period [1].
Regarding waste collection, the average collection rate in Vietnamese urban areas in 2014 was reported to be 85% [1]. In the “National strategy on integrated management of solid waste to 2025, vision to 2050” issued in 2009 [2], The Vietnamese government described the national target of collection rate as 90% of the total MSW generated in 2020, and 100% in 2025. The strategy also indicated the national target for recovery rate including recycled, reused, composted, and energy recovered as 60% of MSW generated in 2020, and more than 85% in 2025. In a related move, the Vietnamese government also issued a decree on waste management and discarded materials in 2015 [3], which prescribed the classification of daily-life solid waste into 3 groups, “Biodegradable organic group”, “Reusable and recycled group” and “the other group”, instead of 2 groups (including “reuse and recycle group” and “buried group”) as stated in the formerin 2007 [4].
Waste collection and transport in Vietnam has been generally done daily without separation by the combination of manual doorto-door collection by handcarts, waste transfer at meeting points along the roadside, and transport by trucks going around the meeting points to pick up waste and carrying it to the landfill site [5-7]. But, the man-powered collection is slow-moving and consequently labour-intensive.
The design of waste collection and transport is also a key factor for planning waste collection and transport. Ishikawa developed a logistics model for estimating number of trucks using 3 policy variables: the truck capacity, the number of collection station, and the collection frequency [8]. Matsui et al. indicated that a larger truck capacity, a smaller number of stations, and less collection frequencies resulted in better collection efficiency [9]. US EPA pointed to “Collection Frequency: Less is Often Best”, and reported twice-perweek collection was almost 70 percent more costly than once-perweek collection. They recommended once-per-week collection even in the hottest climate where summer time temperatures soared to more than 100 degrees Fahrenheits by proper storage [10].
As one of the forward thinking municipalities in Vietnam, Da Nang city has been trying to improve the operation efficiency of waste collection and transport, and has introduced various collection systems in some parts of the city; e.g., tricycle collection, dustbin collection, and truck collection. However, the plan for waste collection and transport has been empirically designed, and the operation efficiency has not been well considered even in this motivated city.
Increase in collection coverage and introduction of separate collection are the key issues with high priority in Vietnamese MSW management under the rapid increase of MSW generation. To achieve the challenging national targets, municipalities in Vietnam need to consider the methods and factors to improve the operation efficiency, and design a rational plan for waste collection and transport with the support of scientific information.
Objective of This Study
Regarding the data collection and analysis on waste collection and transport, some studies applied GPS (Global Positioning System) devices to get the tracking data on vehicles, and also analyzed the data by GIS (Geographic Information System) software [11,12]. In addition, a function of optimization served by GIS software was also applied to minimize the fuel consumption, travel distance and time [13,14]. One of the authors, Matsui, had some experiences to apply GPS devices and a GIS software for waste collection and transport in Japan and Vietnam [5-7,15-19]. The applications of GPS enabled the detailed analysis and modelling of operation time and distance of waste collection and transport.
In this study, the authors focused on the major alternatives of waste collection and transport used in Da Nang city. Clarify the impacts of policy factors such as the truck capacity and the collection frequency efficiency. In addition, the authors also tried to estimate the operation efficiency of separate collection of biodegradable waste as the most likely alternative in the near future.
Materials and Methods
Overview and waste management of Da Nang city
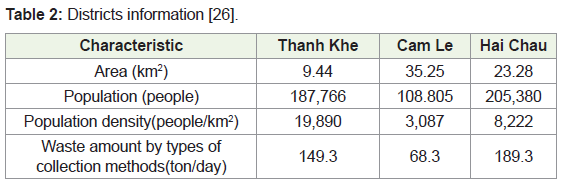
Da Nang city, a port city located on the coast of South China Sea, is the largest city in central Vietnam. Da Nang is fifth populated city in Vietnam with a population of 1,046,876 as of 2015, and with an area of 1,285.4 km2 [20]. Da Nang is subdivided into 8 districts: 6 urban districts (Cam Le, Hai Chau, Thanh Khe, Lien Chieu, Ngu Hanh Son, and Son Tra), and 2 rural districts. They are further subdivided into 1 commune-level town, 14 communes, and 45 wards.
Municipal Solid Waste (MSW) in Da Nang city is generated from various sources including households, commercial and institutional sectors such as hotels, restaurants, markets, shops, offices, schools, institutions, hospitals, airports, parks, etc. MSW in Da Nang city is managed by Da Nang Urban Environment Company (hereinafter referred to as “Da Nang URENCO”).
According to the report of Da Nang URENCO, the waste generation rate was approximately 0.65 kg/cap/d, and the average daily collection amount reached approximately 700 tons/d in 2014. Regarding the waste composition, organic matters accounted for 68.5%, followed by plastic (11.4%), soil and sand (6.8%), paper (5.1%), and wood (2.8%) [21].
The collection rate in 2015 reached 93% (98% of which was from urban areas). The collected MSW is carried to a landfill site without intermediate treatment.
Current practice of waste collection and transport in Da Nang
Da Nang city has introduced various collection systems in some parts of the city. The schematic diagram of representative systems for collection and transport in Da Nang is shown in Figure 1, and the outline of each system is indicated as follows:
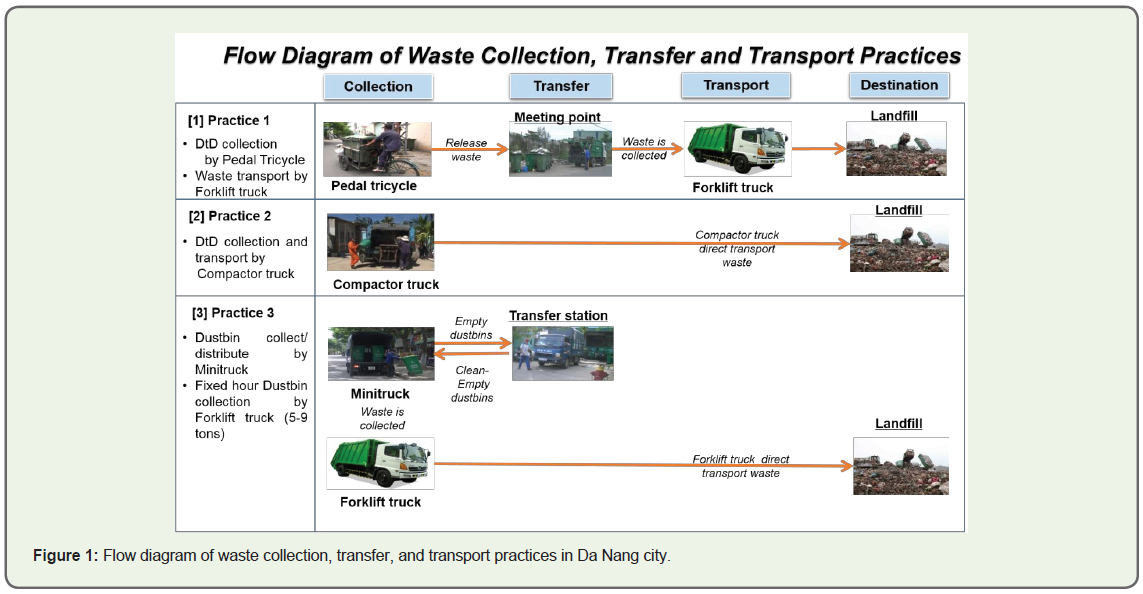
(1) Practice 1: Door-to-door collection by tricycle and transport by truck (hereinafter referred to as “Door-to-door collectionby tricycle”)
A waste collection worker visits households from door to door to pick up the waste discharged at the side of the road by plastic bag, basket or foam box. The worker moves by tricycle with a 660L dustbin (DB), loads the waste into the dustbin, and carries it to a meeting point for transfer. In some areas, the worker rings a bell to inform the residents of waste collection and waits for a while, then the surrounding residents bring their waste for collection. At the meeting point, a forklift truck with loading and compaction equipment transfers the waste by turning over the dustbin, and transports it to the landfill site. This combination system is the common and traditional system for domestic waste in the central area of Da Nang city. The load capacity of forklift truck generally ranged from 5 tons – 9 tons, and the truck is operated by 1 driver and 2 workers.
(2) Practice 2: Door-to-door collection and transport by truck (hereinafter referred to as “Door-to-door collection by truck”)
A compactor truck with a loading and compaction equipment visits households from door to door to pick up the waste discharged at the side of the road by plastic bag, basket or foam box. The driver keeps driving at a walking pace, and the collection workers follow the truck and load the waste directly into the truck. The truck plays music to inform the residents of waste collection, and some of the surrounding residents bring their waste for collection. After the waste collection, the truck directly carries the waste to the landfill site without transfer. This system is a newly introduced system, and applies in suburban and newly developed areas. The load capacity of compactor truck is generally 3.5 tons, and is operated by 1 driver and 2 workers.
(3) Practice 3: Dustbin collection and transport by truck (hereinafter referred to as “Fixed time dustbin collection”)
Several tens of households share a dustbin with a capacity of 240L/280L/660L. This is put at the side of the road based on the e agreement and convenience of surrounding residents. Every day, the empty dustbins are placed from 14:30 to 15:00 by a small liftequipped truck (mini-truck). Then, the residents are requested to bring their waste and put it into the dustbin by themselves. A large forklift truck comes to transfer the waste by turning over the dustbin at the fixed time from 21:00 to 22:00, and directly carries it to the landfill site. The empty dustbins are subsequently collected by the mini-truckand cleaned [22]. This system was introduced on trial for 41 routes in 6 urban districts [23]. The mini-truck is operated by 1 driver and 2 workers. The load capacity of forklift truck is generally approximately 4.5 tons – 10 tons, and the truck was operated by 1 driver and 2 workers.
Regarding business sectors with large amounts of waste generated, they keep their own dustbins and do not have a daily dustbin distribution. There are some dustbins for public use put along the main streets.
(4) Other practices
Da Nang URENCO also applies electronic bikes, motorbikes and transfer stations, but the operation condition is quite different from the former 3 practices, e.g., applied for inconvenient routes and longer distances hauls.
Outline of tracking survey and analytical method
(1) In this paper, the authors focused on the vehicles used for the former 3 practices shown in Figure 1 such as tricycles, compactor trucks and forklift trucks, and conducted the following 3 surveys to collectdata on distance, time and amount of waste collected and transport. The operation data onmini-trucks were also obtained from Da Nang URENCO. A GPS logger, Transystem 747A+ GPS Trip Recorders [24], was attached to the target vehicles. The logger recorded the coordinate data by the second, and the tracking data were mainly used to analyze the distance and velocity of waste collection and transport by GIS software, ArcGIS 10.1.
(2) Video recording
The surveyors followed the target vehicles and recorded the operations of vehicles and collectors by a video camera. The recorded movies were used to analyze the operation time by operation category and the number of loaded waste.
(3) Measurement of waste amount
The authors surveyed the data on waste amount by a round trip. The weight of waste collected by a tricycle was measured at the meeting points by 1-ton digital scale measuring a minimum of 500 grams (g). The weight of waste transported by a truck was measured by the weighbridge at the entrance of the landfill site.
The authors also counted the total number of bags/boxes/baskets/dustbins/handcarts by each round trip from the recorded movies. Based on the data on total collection amount and the total number of bags/boxes/baskets/dustbins/handcarts by each round trip, the authors developed a regression model for the total weight by the total number of bags/boxes/baskets/dustbins/handcart as explanatory variables.
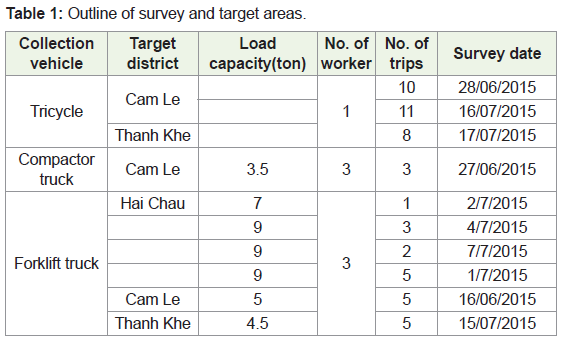
(4) Outline of survey
The outline of survey and target areas is summarized in Table 1. Three districts in Da Nang city, Hai Chau, Cam Le and Thanh Khe, were selected to conduct the surveyfrom June 16th to July 17th, 2015.
The operations of waste collection and transport were composed of the following processes:
1) Moving forward to collection area (e.g., from the parking/meeting point/landfill site to the 1st collection point)
2) Waste collection in collection area
3) Moving backward from collection area (from the last collection point to meeting point/landfill site)
4) Unloading
5) Others
Others include the rest time for meals/drinks/toilets, the waiting time for the truck to transfer waste at the meeting point in case there were no available empty dustbins for collection, and the time for separating recyclables for selling.
Regarding “Practice 3: Fixed time dustbin collection”, the process of collecting waste was further analyzed in detail as follows:
2a) Preparation at collection point: The time excluding “2b) Actual loading at collection point”. At each collection point, the worker commonly spent time to prepare and carry the dustbin to the truck before uploading as well as sending them back to the original location afterward [24]. The time for preparation at the collection point was separately considered in this study.
2b) Actual loading at collection point: The time for transferring waste from the dustbins to the truck, from the 1st touch to the last release of dustbins.
2c) Moving between collection points: The time for moving between collection points in the target collection area
The data on operation distance and time were analyzed and discussed by the abovementioned operation categories. The operation velocity for moving was also calculated (Table 2).
Results and Discussion
Outline of operation of pedal tricycle
(1) Daily operation and operation efficiency
The authors surveyed 3 pedal tricycles in 3 wards. Table 3 shows the outline of operation of 3 tricycles and the average by trip.
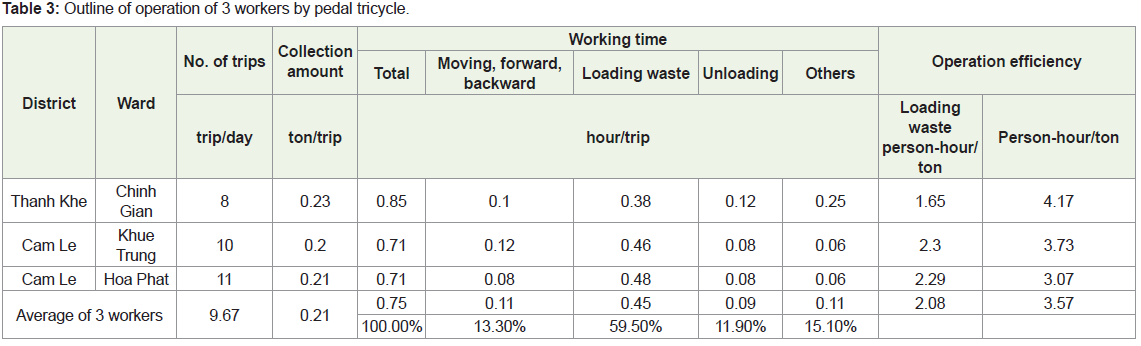
The collectors made round trips for door-to-door collection for 8 to 11 times a day. The averages of collection amount and working time for 1 trip were 0.21 tons and 0.75 h, respectively. Regarding the detailed breakdown of working time, Waste collection was dominant (59.6%), followed by Others and Unloading. The time for Moving forward and backward had a smaller proportion.
The tracking coordinate data for the tricycle were unstable especially for the data at narrow alleys, because GPS needs to have a “clear view” of the sky in order to give its most accurate reading [27]. So, the authors did not analyze the distance and velocity for the tricycle in this study.
The operation efficiency was estimated by dividing the total working time by the collection amount. The average operation efficiency was 3.57 person-hours/t, and there was no significant difference among 3 wards by ANOVA (F=2.135, p=0.136).
(2) Waste weight and waste generation rate
The waste was discharged by bags/boxes/baskets from households for the door-to-door collection. The total collection amount in 3 wards was 5,569 kg, and the total number of discharged waste by bags/boxes/baskets was 2,485 pieces. Thus, the average waste amount per piece was calculated as 2.24 kg/piece. (Three trips including the collection of larger pieces, like dustbins, were excluded from this calculation)
Assuming the average weight of one piece was equivalent to the average of waste generation from one household with the average family size of 4.1persons/family [20], the per capita waste generation was calculated to be 0.55 kg/cap/d. This value was slightly less than the municipal solid waste generation rate reported by Da Nang URENCO (0.65 kg/cap/d). The target areas were residential areas and there were fewer business sectors than downtown, which is a possible reason for the difference in waste generation rate.
Outline of operation of compactor truck
The authors surveyed 3 trips of 1 compactor truck with 3.5-ton capacity. Compactor trucks were used for Practice 2 “Door-to-door collection by truck” as well as the waste transport for Practice 1. The target truck served for Practice 2 “Door-to-door collection by truck” in some parts of the second trip, and also served for the waste transport for Practice1 for the remaining part of the collection routes. Table 4 shows the outline of daily operation of 3 trips.
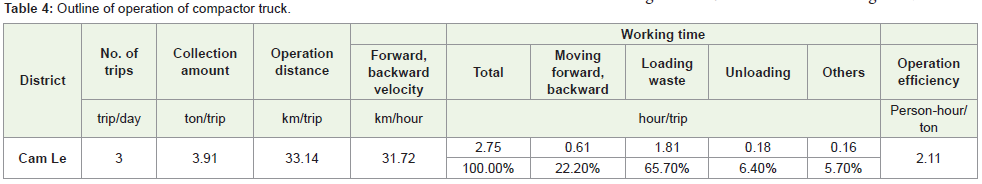
The collection amount and the operation time for 3 trips were 11.73 tons and 8.24 h, respectively. Regarding the detailed breakdown of working time, Waste collection was dominant (65.7%), followed by Moving forward and Moving backward. The truck needed to transport the waste for longer distance to the landfill site, so they needed to spend more time for moving forward and moving backward than tricycles. The time for Unloading and Others had a smaller proportion.
Because the compactor truck collected waste by bags/boxes/basketsand dustbins in the same trip, the authors could not calculate the waste weight per piece or dustbin based on the survey data on the compactor truck.
Outline of operation of forklift truck
(1) Daily operation and operation efficiency
The authors surveyed 6 forklift trucks in 3 wards as shown in Table 5.
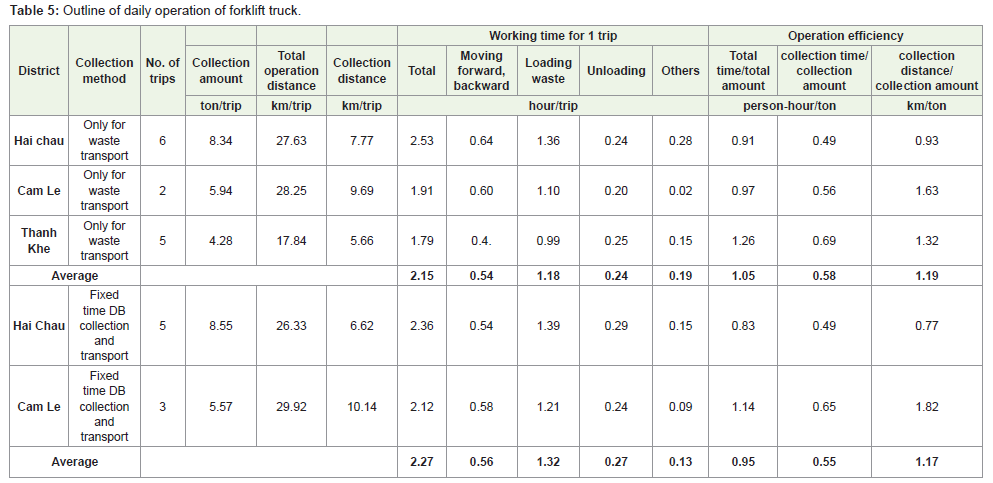
The authors summarized the outline of daily operation for 3 trucks with 21 trips. The target trucks in Cam Le and Hai Chau served for Practice 3 in some parts of their trips, and also served for the waste transport for Practice 1 for the remaining part of the collection routes. In these trips, there were 13 trips the trucks conducted waste collection as a transport function. In 8 trips remaining, the truck not only transported waste but also collected fixed time dustbin.
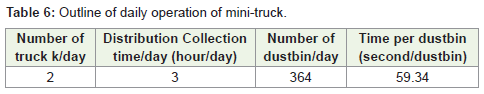
Fixed time dustbin collection system needed empty dustbin distribution and collection by a mini-truck. By the hearing from Da Nang URENCO, 2 mini-trucks worked for 3 h for distribution and collection for 364 dustbins in Hai Chau district as shown in Table 6 [26]. The time per dustbin was calculated as 59.34 s/dustbin.
(2) Waste weight and waste generation rate
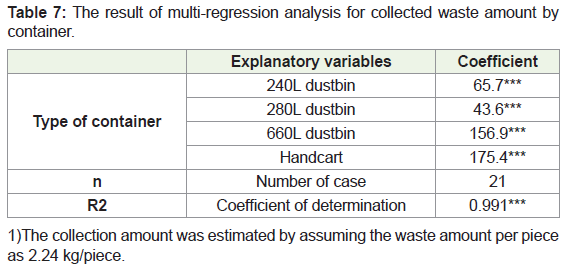
In Da Nang city, 4 types of containers, 240-L dustbin, 280-L dustbin, 660-L dustbin and handcart, were used for MSW collection and transport. The former three types are dustbins used for waste collection and transport, while the handcarts are mainly used for street waste and managed by street sweepers. To estimate the waste amount per each container, the authors implemented mathematical modelling for collected waste amount by tripusing multi-regression analysis. The objective variable was collected waste amount, and the explanatory variables were the number of 4 types of dustbins. Table 7 shows the result of multiple regression analysis for collected waste amount by type of container.
Detail analysis on compactor and forklift trucks
The authors analyzed the operation efficiency indicators and the effects of influence factors on compactor and forklift trucks by the detail operation category as follows: moving forward and backward, waste collection, unloading and other activities.
(1) Moving forward/backward
In Da Nang city, the trucks are parked next to the landfill site. The trucks move forward to collection areas and return to the landfill site to unload the collected waste. Table 8 demonstrates that the average distances for moving forward/backward for the target trucks were 19.8km/trip in Hai Chau district, 19.3km/trip in Cam Le district, and 12.2km/trip in Thanh Khe district. It depends on the distance between the collection area and the landfill site.
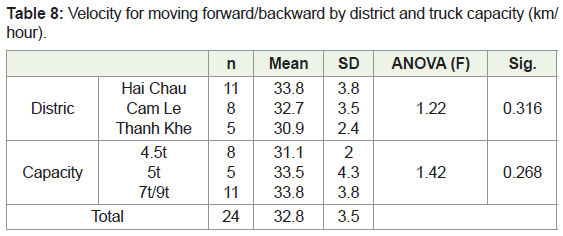
Regarding the velocity of moving forward/backward, the authors could not detect significant differences among districts and capacities of truck. The average velocity for the surveyed 24 trips was 32.8km/h.
(2) Waste collection and transport
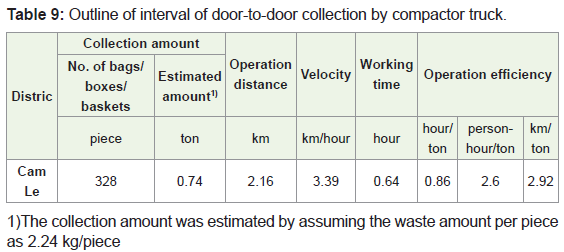
a) Waste collection by door-to-door collection by compactor truck
As mentioned above, the surveyed compactor truck was applied for Practice 2: door-to-door collection by truck as well as the waste transport for Practice 1. The authors focused only on the interval of door-to-door collection and analyzed the operation data as shown in Table 9. Within the interval, the truck collected 328 pieces of waste, which was estimated to be 0.74 tons by assuming the waste amount per piece to be 2.24 kg/piece as calculated in Section 3.1. The collection distance was 2.16 km, and the working time was 0.64h for waste collection. The average velocity for door-to-door collection was 3.39 km/h. The operation efficiency was calculated as 2.60 personhours/t.
b) Waste collection and transport by forklift truck
The target forklift trucks served for Practice 3 “Fixed time dustbin collection” in some parts of their trips, and also served for the waste transport for Practice 1 for the remaining part of the operation routes. The authors separated the operation interval by 2 practices, and analyzed the operation data by practices.
The outline of interval offixed time dustbin collection is shown in Table 10.
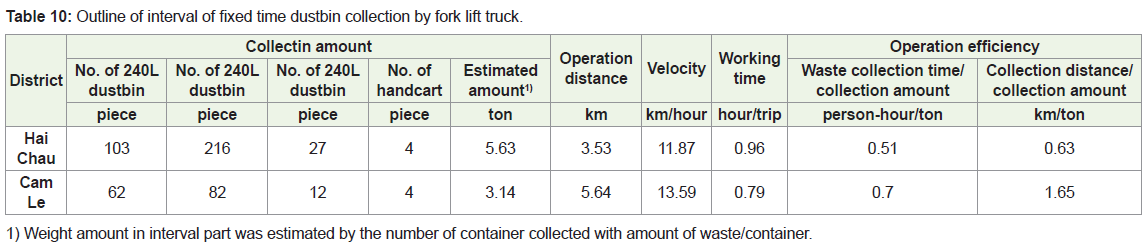
Weight amount in interval part was estimated by the number of container collected with amount of waste/container.
The waste collection process was discussed by the following detail operation categories: Preparation at collection point, Actual loading at collection point, and moving between collection points:
Preparation at collection point
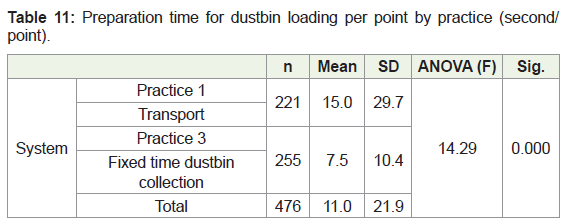
There was significant difference in the time of preparation by the 2 practices (F=14.29, p < 0.001). The time of preparation for Practice 3 was 7.5 s/point, approximately half of that of Practice 1, 15 s/point (Table 11). The dustbins for Practice 3 was often set at the roadside, and the truck workers did not need to spend so much time to move for loading and return them. In contrast, for Practice 1, the dustbins were sometimes kept farther from the roadside at the meeting points, and the workers needed to spend more time for preparation.
Actual loading at collection point
As mentioned above, 4 types of containers were used for MSW collection and transport. To estimate the loading time per each container, the authors implemented mathematical modelling for loading time by multi-regression analysis. The objective variable was the time for loading, and the explanatory variables were the number of 4 types of dustbins. Table 12 shows the result of multiple regression analysis for loading time by type of container.
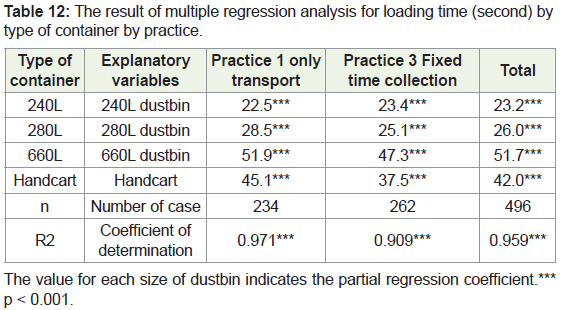
It is suggested that the partial regression coefficient indicates the corresponding loading time for each dustbin. The loading times of Practice 3 were slightly shorter than those of Practice 1 excluding 240-Ldustbin. The forklift truck can upload 2 smaller dustbins with the capacities of 240L and 280L at onetime, while the truck can transfer only one dustbin with the capacity of 660L or one handcart at one time. That would be the possible reason for the difference in loading time among containers. The loading time per dustbin is very similar with the value reported in the case of back-load vehicles, 25 s per dustbin, by Zamorano [28]; and the reported value for average pick up time for one container, 39.43 s, by Apaydin [25].
Moving between collection points
The average distance between collection points for practices 1 and 3 were 495m and 134m, respectively, and the significant difference was found between 2 Practices. The dustbins for Practice 1 are put at the meeting points for door-to-door collection by tricycle, while the dustbins for Practice 3 are putat the side of the road by the agreement and convenience of surrounding residents. That would be the possible reason for the difference.
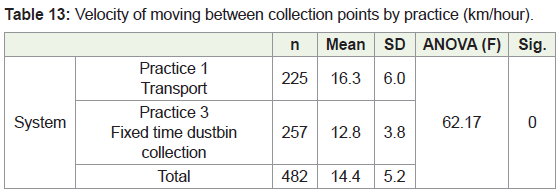
Table 13 shows the velocity of moving between collection points by practice. The average velocities between collection points for practices 1 and 3 were 16.3km/h and 12.8km/h, respectively, and the significant difference was found between 2 Practices. Because the truck needs some distance for acceleration, the shorter distance would result in the slower velocity for Practice 3. The velocity of the truck was similar with the velocity in the Japanese case, 15.6 km/h, reported by Ishikawa (1995) [8].
(3) Unloading time
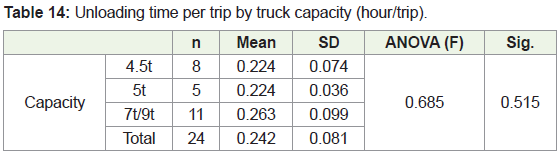
After the trucks come back to the landfill site, they measure the waste amount at the weighbridge, and move into the landfill site to unload the waste. Table 14 shows the unloading time per trip by truck capacity. There was no significant difference among the size of truck, and the average unloading time for the surveyed 24 trips was 0.242 h/trip. The value is near to the waste discharge time at the treatment plant, 10 min, reported by Zamorano, et al. [28].
(4) Other time
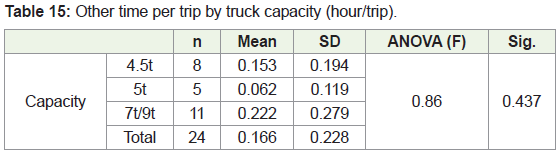
Table 15 shows the other time per trip by truck capacity. There was no significant difference among the size of truck, and the average other time for the surveyed 24 trips was 0.166 h/trip. Previous studies also reported the other time, and the reasons that were mentioned includedtruck break down, human factor, traffic, recycle waste, or queuing on the lane to Dumping site [29], and the time varied from 7% to 30% of total time. During the survey in this study, the workers did not stop for resting and drinking water during collection. The other time was caused by the following reasons:
- In case there was no waste at the meeting point, the trucks for transport needed to wait for door-to-door collectors to bring the waste.
- The trucks stopped because of troubles with some of the trucks.
- At the end of each collection day, the trucks sometimes stopped at junkshops to sell recyclables.
Scenario analysis of operation efficiency
Based on the above mentioned analytical results on MSW collection and transport operation, the authors intended to compare the operation efficiencies of some representative alternatives by scenario analysis and the effects of influencing factors such as, collection frequency, truck capacity, transport distance and waste separation.
(1) Scenario definition and caluculation condition
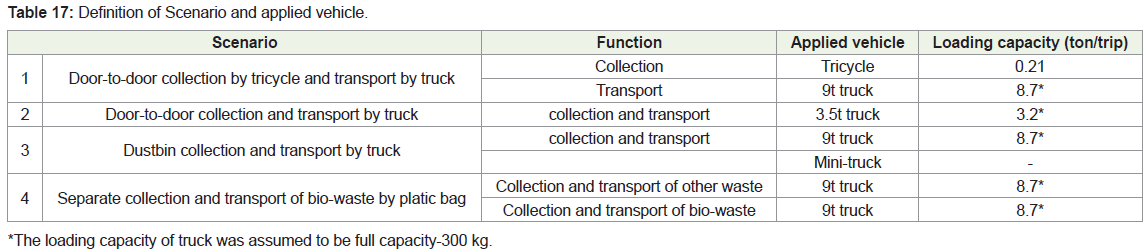
The authors defined 3 representative scenarios based on the current 3 practices in Da Nang city as follows:
Scenario 1: Door-to-door collection by tricycle and transport by truck,
Scenario 2: Door-to-door collection and transport by truck,
Scenario 3: Dustbin collection and transport by truck
In addition, the authors also defined a scenario for separate collection of bio-waste as the most prospective scenario in the near future. In reference to Japanese practices for bio-waste separation, the authors assumed that the waste was separated into 2 categories, i.e., bio-waste and other waste, to be collected by plastic bags at the station.
Scenario 4: Separate collection and transport of bio-waste byplastic bag
The definition of the scenario is shown in Table 16.
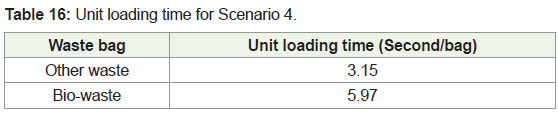
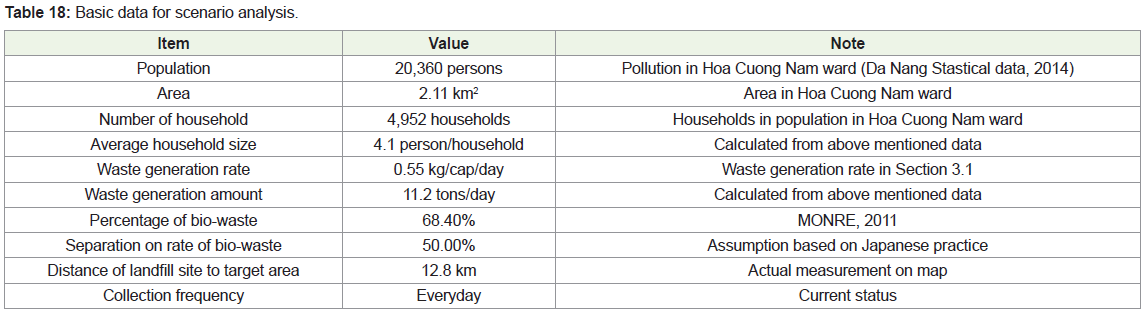
The target area for scenario analysis was Hoa Cuong Nam ward in Hai Chau district, which was surveyed, and the basic data for scenario analysis are summarized in Table 17. The unit loading time for plastic bags for other waste and bio-waste bags in Scenario 4 was referred from Japanese operation data [30].
(2) Dustbin allocation and collection distance for Scenarios 3 and 4
Practice 1 was actually applied tothe target area, while Practice 3 had not been applied yet. For the estimation of Scenarios 3 and 4, the authors needed to assume the position of dustbin, and calculate the needed number of dustbins and the distance for collection in the target area. The procedure of calculation was shown in Figure 2.
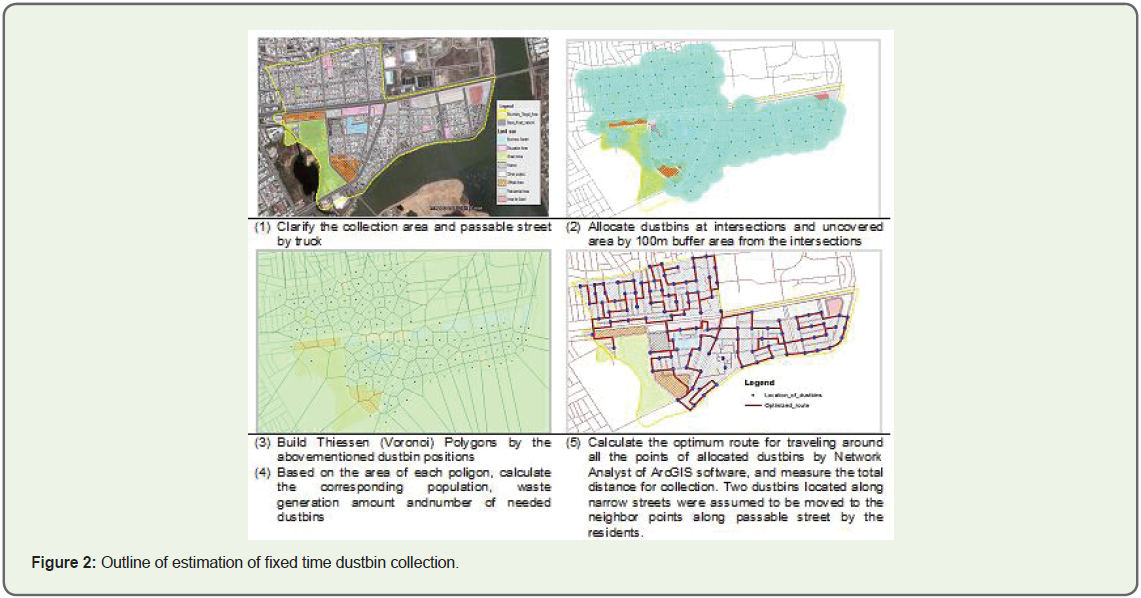
Table 18 By using the GIS software and database on lnd use and street, the authors conducted the following works to calculate the collection routefor Scenarios 3 and 4 in the target area:
1) Clarify the collection area (excluding green, official, sport areas) and passable street by truck (4m width or wider)
2) Allocate dustbins at intersections and uncovered areas by 100m buffer area from the intersections
3) Build Thiessen (Voronoi) Polygons by the above mentioned dustbin positions[31]. Thiessen polygons are polygons whose boundaries define the area that is closest to each point relative to all other points. They are mathematically defined by the perpendicular bisectors of the lines between all points. The boundary of collection area was also considered to construct the polygons.
4) Based on the area of each poligon, calculate the corresponding population by population/km2 in the target collection area, then estimate the waste generation amount by 0.55 kg/cap/das well as the number of needed dustbins.
5) Calculate the optimum route for traveling around all the points of allocated dustbins by Network Analyst of ArcGIS 10.1 [14], and measure the total distance for collection in the target area.
(3) Operation parameters for scenario analysis
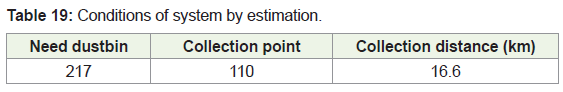
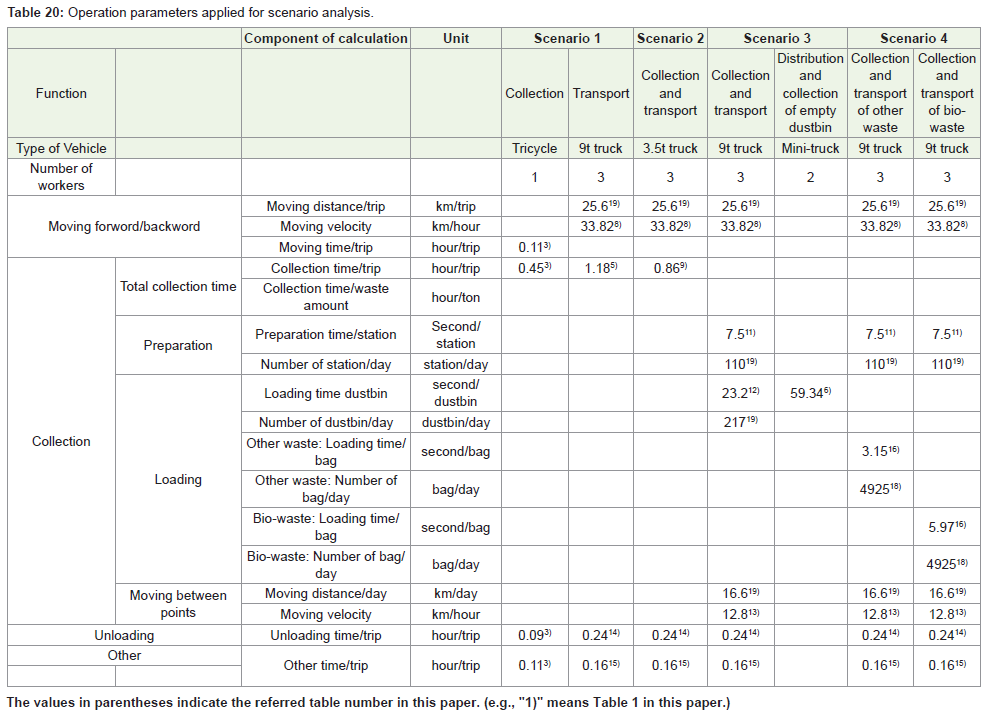
Table 19 For the scenario analysis, the authors intended to estimate the needed person-hours/t as the representative indicator for operation efficiency. In reference to the above mentioned analytical results on operation, the authors extracted the needed operation parameters applied for scenario analysisas shown in Table 20. Based on the definition, basic data and operation paremeters for scenario analysis, the authors calculated the person-hours/t for waste collection and transport.
(4) Operation efficiency by scenario
Table 21 indicates the operation efficiency of each scenario and some relevant values for the scenario analysis. Among the current 3 practices, Scenario 1 “Door-to-door collection by tricycle and transport by truck” had the lowest efficiency of 4.39 person-hours/t, the tricycle needed larger number of trips because of the small loading capacity, and spent a longer collection time (39.46 h/d) than other scenarios. The operation efficiency of Scenario 2 “Door-to-door collection and transport by truck” was 3.70 person-hours/t, which was slightly better than Scenario 1. Scenario 3 “Dustbin collection and transport by truck” achieved the highest efficiency of 2.15 personhours, which was less than half of Scenario 2. The contribution of mini-truck applied to empty dustbin contribution and collection was 59.34 s/dustbin, which was not ignorable in total human resources. It also demonstrated that DB collection had higher efficiency than door-to-door collection.
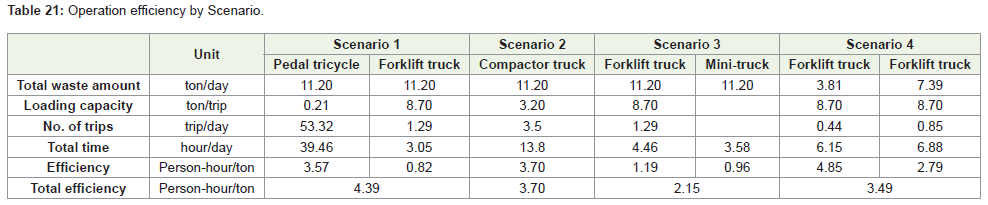
Regarding the separate collection of bio-waste, the operation efficiency of Scenario 4 was 3.49 person-hours/t. It was better than door-to-door collection scenarios, which means Scenario 4 would be a feasible alternative that can replace Practices 1 and 2.
(5) Sensitivity analysis
The design variables of waste collection and transport would affect the operation efficiency. The authors focused on Scenario 3 as the best practice, and conducted sensitivity analysis to clarify the effects of influencing factors on operation efficiency such as collection frequency, truck capacity, and distance to landfill site. The collection frequency affects the collection area for one day, e.g., the collection area of “Once per week” is one seventh of that of “7 days per week”. It thus affects the collection time. The truck capacity affects the needed number of trip, and the distance to landfill site affects the distance of moving forward and backward. Thus these 2 factors affect the transport time.
In addition, the authors focused on Scenario 4 as the most prospective practice in the near future, and conducted sensitivity analysis by collecting frequencies and separating the rate of bio-waste.
Sensitivity of collection frequency and truck capacity for Practice 3
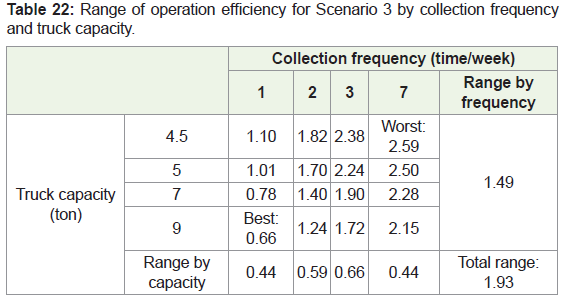
The authors analyzed the operation efficiency of Scenario 3 in the target area in Hai Chau district by various collection frequencies and truck capacities as shown in Table 22. The other parameters were same as the abovementioned scenario analysis. Firstly, the authors considered the collection frequency from 1 to 7 times per week, and truck capacity from 4.5 tons to 9 tons. The best efficiency was 0.66 person-hours/t achieved at “Once per week and 9t”, and the worst efficiency was 2.59 person-hours/t at “7 times per week and 4.5t”. The range of efficiency by collection frequency from “Once per week” to “7 times per week” was 1.49 person-hours/t, while the ranges by truck capacity from “4.5t” to “9t” were from 0.44 person-hours/t to 0.66 person-hours/t.
Sensitivity of distance to landfill site for Practice 3
Da Nang is a big city, and the distance of moving forward and backward was different among the collection areas. The distance of the nearest collection area, Hoa An ward in Cam Le district, is 4.9km; and that of the farthest collection area, Hoa Hai ward in Ngu Hanh Son district, is 22.0km. The authors intended to explore the impact of distance to landfill, and analyzed the range by capacity of the truck in these 2 wards. The ranges of operation efficiency by truck capacity from “4.5t” to “9t” were 0.26 person-hours/t – 0.39 person-hours/t in the nearest Cam Le district, and 0.65 person-hours/t – 0.98 personhours/t in the farthest Ngu Hanh Son district.
To improve the collection efficiency, the expected impact of collection frequency was larger than that of truck capacity, even in the farthest collection area.
Sensitivity of collection frequency for Practice 4
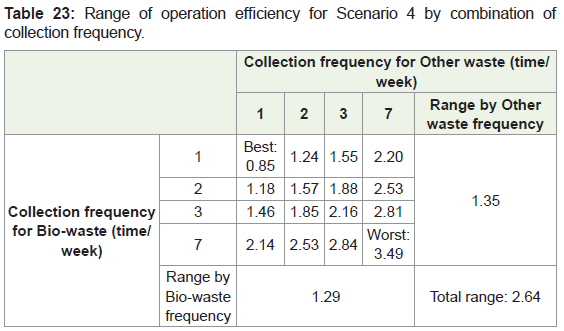
The authors analyzed the operation efficiency of Scenario 4 in the target area in Hai Chau district by various combinations of collection frequencies of bio-waste and other waste. The applied truck capacity was defined as 9t, and the other parameters were same as the scenario analysis. The best efficiency was 0.85 person-hours/t achieved at “Once per week for 2 waste categories”, and the worst efficiency was 3.49 person-hours/t at “7 times per week for 2 waste categories”. In some conditions shown by green cells in Table 23, e.g., “7 times per week for bio-waste and once per week for Other waste”, the personhours/t were smaller than that of Scenario 3. In order to introduce separate collection of bio-waste without too much increase in personhours/t, it is indispensable to consider proper collection frequency.
Sensitivity of separation rate for Practice 4
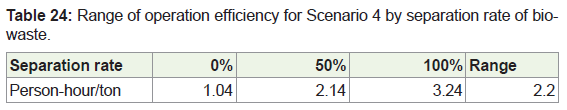
The authors focused on the operation efficiency of “7 times per week for bio-waste and once per week for other waste”, of which person-hours/t was nearly equal to that of Scenario 3, and analyzed the operation efficiency by various separation rates from 0% to 100%. When the separation rate of bio-waste increased, the number of bag for bio-waste increased, and consequently the total collection time increased. The operation efficiencies were 1.04 person-hours/t at “0%”, and 3.24 person-hours/t at “100%”, which is shown in Table 24. The range of operation efficiency by separation rate was 2.20 personhours/t, which was the largest range among those of influence factors considered in the sensitivity analysis. Separation rate is a critical factor on operation efficiency, and should be carefully considered for planning separate collections.
Conclusion
In this study, the authors focused on the major alternatives of waste collection and transport practices used in Da Nang city. GPS devices and GIS software were used to survey and analyze detailed tracking data on 3 current practices, “Door-to-door collection by tricycle and transport by truck”, “Door-to-door collection and transport by truck”, and “Fixed time dustbin collection and transport by truck”. The authors intended to estimate the operation efficiencies of these practices, and clarify the impacts of policy factors such as truck capacity and collection frequency. In addition, the authors also tried to estimate the operation efficiency of separate collection of bio-waste as the most likely alternative in the near future. The major findings were as follows:
1) By using the data for the 3 current practices on operation time, operation distance, and collected amount, key statistics for each parameter were calculated.
2) The operation efficiency indicators such as unit operation time, person-hours/t and operation velocity were calculated by the detail operation category: Moving forward and backward, Waste collection, waste unloading and other activities.
3) Using multi-regression analysis, the authors estimated the unit loading time and the unit waste amount for 4 types of containers, 240-L dustbin, 280-L dustbin, 660-L dustbin and Handcart.
4) Using scenario analyses in Hoa Cuong Nam ward in Hai Chau district, the operation efficiency of “Door-to-door collection” was 4.39 person-hours/t, which was lowest among the current 3 practices, and that of “Door-to-door collection and transport by truck” was 3.70 person-hours/t. “Fixed time dustbin collection and transport by truck” achieved the highest efficiency of 2.15 personhours, which was less than half of “Door-to-door collection and transport by truck”.
5) The operation efficiency would be affected by truck capacity and collection frequency. By sensitivity analysis on “Fixed time dustbin collection and transport by truck”, the best efficiency was 0.66 person-hours/t achieved at “Once per week and 9t”, and the worst efficiency was 2.59 person-hours/t at “7 times per week and 4.5t”. The variation range of operation efficiency by collection frequency from “Once per week” to “7 times per week” was 1.49 person-hours/t, while the ranges by truck capacity from “4.5t” to “9t” were from 0.44 person-hours/t to 0.66 person-hours/t. To improve the collection efficiency, the expected impact of collection frequency was larger than that of truck capacity, even in the farthest collection area.
6) The operation efficiency of separate collection of bio-waste by plastic bag was 3.49 person-hours/t. It was better than doorto-door collection scenarios, which means it would be a feasible alternative that can replace door-to-door collection practices.
7) As sensitivity analysis of separate collection of bio-waste by plastic bags, the operation efficiencies by various combinations of collection frequencies of bio-waste and other waste were assessed. The best efficiency was 0.85 person-hours/t achieved at “Once per week for 2 waste categories”, and the worst efficiency was 3.49 person-hours/t at “7 times per week for 2 waste categories”. The authors found some conditions with better efficiencies than “Fixed time dustbin collection and transport by truck”, e.g., “7 times per week for bio-waste and once per week for other waste”. The variation ranges of operation efficiency by separation rate were 2.20 person-hours/t, which was the largest range among those of influence factors considered in the sensitivity analysis. To introduce separate collection of bio-waste, it is indispensable to consider proper collection frequency. Separation rate is a critical factor on operation efficiency, and should be carefully considered for planning separate collection.
References
- Ministry of Natural Resources and Environment (MONRE) (2015) National environment report 2011-2015. (In Vietnamese).
- Vietnam Government (2009) Decision No. 2149/QD-TTg on approving the national strategy of integrated solid waste management up to 2025, vision towards 2050.
- Viet Nam (2007) Decree No. 59/2007/ND-CP on Solid waste management pp. 4-21.
- Viet Nam (2015) Decree No.38/2015/ND-CP on Solid waste management.
- Thanh NP, Matsui Y, Ngan NV, Trung NH, Vinh TQ, et al. (2009) GIS application for estimating the current status and improvement on municipal solid waste collection and transport system: Case study at Can Tho city, Vietnam. Asian J on Energy and Environment 10: 108-121.
- Thanh NP, Matsui Y, Lanh NT (2011) A preliminary survey on residential solid waste generation and door-to-door collection by using GIS/GPS: a case study in Can Tho city, Vietnam. Proceedings of the 22nd annual conference of Japan Society of Material Cycles and Waste Management 562-563.
- Thanh NP, Matsui Y (2011) Municipal solid waste management in Vietnam: Status and the strategic actions. International Journal of Environmental Research 5: 285-296.
- Ishikawa M (1996) A logistics model for post-consumer waste recycling. J Pack Sci Technol 5: 119-130.
- Matsui Y, Osako M, Moriguchi Y, Takahashi K, Saito S, et al. (2004) A study on cost and environmental loads of separate collection and transport of containers and packaging. Proceedings of the 25th conference of Japan Waste Management Association, 4-6. (in Japanese)
- U.S. EPA (U.S. Environmental Protection Agency) (1999) Collection efficiency: Strategies for success. EPA530-K-99-007. Washington, DC: Solid Waste and Emergency Response (5306W). U.S. EPA.
- Yadav SK (2013) GIS Based approach for site selection in waste management. International Journal of Environmental Engineering and Management 4: 507-514.
- Kallel A, Serbaji MM, Zairi M (2016) Using GIS-Based tools for the optimization of solid waste collection and transport: Case study of Sfax City, Tunisia. Journal of Engineering pp. 7.
- Tavares G, Zsigraiova Z, Semiao V, Carvalho MdG (2009) Optimisation of MSW collection routes for minimum fuel consumption using 3D GIS modelling. Waste manag 29: 1176-1185.
- Chalkias C, Lasaridi K (2009) A GIS based model for the optimisation of municipal solid waste collection: The case study of Nikea, Athens, Greece. Technology 1: 11-15.
- Matsui Y, Tanaka M, Tsukuni Y, Tekeuchi C (2005) Estimation on cost and environmental loads of separate collection and transport of containers and packaging in consideration of area characteristics. Proceedings of the 26th conference of Japan Waste Management Association 106-108.
- Matsui Y, Yasue T (2008) Uncertainty analysis on estimation models for cost and environmental loads on waste collection and transport. Proceedings of the 19th conference of annual conference of Japan Society of Material Cycles and Waste Management 185-187.
- Matsui Y, Yasue T, Lu L, Tanaka M (2009) Development of Predictive Models for Cost and CO2 emission on Segregate Collection System. Proceedings of Waste and Climate Conference.
- Matsui Y, Anh TY, Trang DT, Thanh NP, Nu PT, et al. (2012) Comparison of operational efficiency among waste collection systems in Da Nang city, Vietnam. Proceedings of the 7th asian pacific landfill symposium (APLAS): Sustainable Solid Waste Management for a Better Life.
- Matsui Y, Trang DT, Muroyama K, Aihara K (2012) Scenario analysis on separate collection of food waste from business sectors and kitchen waste from households. Proceedings of the 33rd conference of Japan Waste Management Association. (in Japanese)
- Da Nang General Statistics Office (2015).
- Ministry of Natural Resources and Environment (MONRE) (2011) National environment report.
- Anh TT (2013) Comparison of operational efficiency among waste collection systems in Da Nang city, Viet Nam. (Master thesis of Okayama University). Retrieved from Okayama University Library database.
- Vietnam Environment Administration (2014). 44 routes for fixed time dustbin collection in Da Nang city.
- Transystem (2010) Information on 747A+.
- Apaydin O, Gonullu M (2011) Route time estimation of solid waste collection vehicles based on population density. Global NEST Journal 13: 162-169.
- Da Nang URENCO (2015). Report on Solid Waste Management.
- National Geographic Maps (2017) Using a GPS unit.
- Zamorano M, Molero E, Grindlay A, Rodríguez ML, Hurtado A, et al. (2009) A planning scenario for the application of geographical information systems in municipal waste collection: A case of Churriana de la Vega (Granada, Spain). Resources, Conservation and Recycling 54: 123-133.
- Essien OE, Udo J (2013) Estimating Time Loss Effects On Municipal Solid Waste Collection Using Haul Container System In Uyo Nigeria. American Journal of Engineering Research 2: 369-377.
- Matsui Y (2009) Comprehensive report in FY 2008 for waste management research grant on “Cost-Effectiveness and Cost-Benefit Analyses on separate collection and junction transport”. Ministry of the Environment, Japan.
- Anghinolfi D, Paolucci M, Robba M, Taramasso AC (2013) A dynamic optimization model for solid waste recycling. Waste Manag 33: 287-296.