Research Article
Analysis of Transaction Costs forREDD+ Trial Payment Scheme in Kilosa District, Tanzania
Mariam Mrutu1, John Francis Kessy2, Yonika Mathew Ngaga2 and Beatus John Temu2*
1Tanzania Forest Service Agency, P.O. Box 40832, Dar es Salaam, Tanzania
2Department of Forest Economics, Sokoine University of Agriculture, P.O.Box 3011, Morogoro, Tanzania
Corresponding author: Beatus John Temu, Department of Forest Economics, Sokoine University of Agriculture, P.O.Box 3011, Morogoro, Tanzania; E-mail: beatustemu@gmail.com
Citation: Mrutu M, Kessy JF, Ngaga YM, Temu BJ. Analysis of Transaction Costs for REDD+ Trial Payment Scheme in Kilosa District, Tanzania. J Environ Soc Sci. 2016;2(2): 117.
Copyright © 2016 Temu BJ. This is an open access article distributed under the Creative Commons Attribution License, which permits unrestricted use, distribution, and reproduction in any medium, provided the original work is properly cited.
Journal of Environmental and Social Sciences | Volume: 3, Issue: 1
Submission: 07/01/2016; Accepted: 23/01/2016; Published: 28/01/2016
Abstract
This paper analyzes transaction costs for REDD+ trial payment scheme, based on the survey of 120 households belonging to four villages under REDD+ trial payment in Kilosa District. The analysis revealed that, estimated total transaction costs were TZS 2 704 ha-1 yr-1 equivalent to USD 1.7 ha-1 yr-1. The CBA results show that, the magnitude of NPV decreases by 90% with increase in discount rate from 15% to 31 %. The IRR is 33.7 % higher than the World Bank rate of 15% and the BOT rate of 20.6 % implying that the project is efficient. Local communities perceived REDD+ trial payments as important approach towards improving their forests and were satisfied with payments method used. The study concludes that most of transaction costs (99.7%) were carried by TFCG-MJUMITA project for implementing REDD+ project while villagers or communities implementing the project carried a tiny fraction of it. TheREDD+ project worth to undertake since it is economically efficient and well perceive by the communities in terms of promoting villages’ forest conservation and income gain. It is recommended that Government intervention to pay for transaction costs could ensure sustainability of village forests under REDD+ particularly after donor support for such projects is ended. Villagers’ capacity to cover for transaction costs to implement REDD+ in their villages’ forests is lacking.
Keywords: Transaction costs; REDD+ trail payments; CBA
Introduction
Climate change is one of the biggest global problems posingchallenges to sustainable livelihoods and economic development,mainly for Least Developed Countries (LDCs) [1]. The adverseimpacts of climate change on environment, human health, foodsecurity, human settlements, economic activities, natural resourcesand physical infrastructure are already noticeable in many countries.To address this problem, a system of payments for ReducedEmissions from Deforestation and Forest Degradation (REDD) hasbeen established in Developing Countries. In 2008, COP 14, REDD+was the official language defined in Bali Action Plan. The ‘+’ in REDD+ widens the scope of the mechanism to include conservationand enhancement of forest carbon stocks, as well as the SustainableManagement of Forests (SMF).To this effect, a set of policies knownas REDD+ has gained momentum in international climate changenegotiations as a cost effective way to reduce greenhouse gas (GHG)emissions after expiration of the post Kyoto Protocol in 2012 [2].
Both REDD and REDD+ are intended to reduce carbon emissioninto the earth’s atmosphere through large scale purchases and salesof forest carbon. While REDD+ seeks to address the main problemof tropical forest loss but, the social costs of tropical deforestationand the architects of REDD+ face a range of transaction costs in structuring the programme [3]. Transaction costs refer to the costsof the various activities needed to make an economic exchange[2]. REDD+ transaction costs arise at three levels: Negotiation ofagreement with land owners, monitoring, reporting and verificationof carbon and enforcement of agreement if the parties do not fulfiltheir obligations [4]. In this study, transaction costs are consideredas the costs of different activities required to run a REDD+ trialpayments project.
Tanzania is one of the countries exploring different modalitiesof implementing REDD+ and various activities to that effect aregoing on. Kilosa District is piloting REDD+ payment throughTanzania Forest Conservation Group (TFCG) in partnership with theCommunity Forest Conservation Network of Tanzania (MJUMITA)under the project known as “Making REDD work for Communitiesand Forest Conservation in Tanzania”. It is a five years project thatstarted in 2009 up to 2014. The project aims at reducing Green HouseGases (GHGs) emissions from deforestation and forest degradationin Tanzania in ways that provide direct and equitable incentives tocommunities to conserve and manage forests sustainably. The projectsupports the development of a Community Carbon Enterprise underCommunity Based Forest Management (CBFM) [5].
In order for carbon trading through REDD+ payment schemeto be profitable to target communities, the costs associated with its‘harvesting’, including transaction costs, have to be much lower thanthe market price of the carbon [4]. The process of carbon monitoringinvolves a lot of bureaucratic, complicated and expensive steps ofwhich at the end, have to be paid for by the producer [6]. This impliesthat, financial gains to the local communities are likely to be reducedand distributed out thinly if transaction costs are high. This maydiscourage the communities towards REDD+ payments. However,the magnitude of transaction costs associated with the trial paymentsis currently not known.
A study by Antinori and Sathaye [7] on transaction costs ofproject-based GHG’s emissions trading in developed and developingcountries estimated a mean transaction costs of USD 0.38/tCO2e ina sample of project-based Clean Development Mechanism (CDM)forestry projects and found strong economies of scale. Likewise,estimated cost elements of REDD+ in Tanzania revealed an annualtransaction cost of about USD 25 000 (USD 0.075 million over 3 years)[8]. However the costs considered by the study, included only partof monitoring reporting and verification costs and REDD+ projectdevelopment costs. Other costs like enforcement costs, negotiationwith land owners, costs of acquiring monitoring equipment’s, costof conducting monitoring and certification cost of GHG’s reductionswere not included hence underestimation of the real costs. Thisstudy was conducted to provide a more exhaustive cause of the costelements.
Methodology
Description of the study area
The study was conducted in four villages: Chabima, DodomaIsanga, Nyali and Kisongwe in Kilosa District (Figure 1). The Districtlies between latitude 5°55’ and 7°53’ south and longitudes 36°30’ and37°30 east (Figure 1). The District was purposively selected based on the location of REDD+ pilot project and trial payments which havebeen conducted in six out of thirteen villages. The four villages wererandomly selected out of the six villages covered by the trial payment.The sample of respondents for the survey was drawn randomly usingrandom numbers by picking names of household heads from the listof REDD+ trial payments register book.
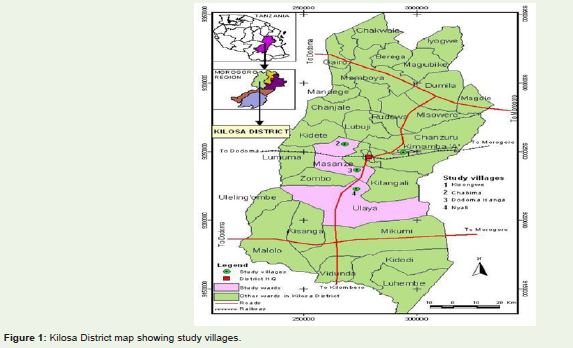
Figure 1: Kilosa District map showing study villages.
Data collection
Primary data were collected by the use of structured questionnairewith both closed and open-ended questions. The questionnaire wasdesigned to collect data on transaction cost where by respondents wereasked to state the amount of time they invested on transaction relatedactivities. Moreover, it covered information on transaction costs andbenefits of the project and their perception towards trial payments.One hundred and twenty (120) respondents were interviewed in allfour villages. Key informants and participant’s observation were alsoemployed. Secondary data were collected to support primary data.
Data analysis
Statistical Package for Social Sciences (SPSS version 17) wasused to analyse quantitative data whereby analysis was based ondescriptive statistics and then, presented in the form of tables andfigures. Cost Benefit Analysis (CBA) was done to assess the economicefficiency of the project to offset transaction cost. Content analysistechnique was employed to analyze qualitative information capturedthrough participant observation and semi structured interviews.In this analysis, the components of verbal discussion held with keyinformants was analyzed in detail, whereby recorded dialogue withrespondents was broken down into smallest meaningful units ofinformation [9].
Identification of transaction cost and benefits
Two types of costs incurred during implementation of aREDD+ trail payment scheme were identified for analysis. Thefirst category was transaction cost incurred by TFCG/MJUMITAproject in monetary terms during implementing a REDD+ trialpayment scheme. They include; monitoring and verification, REDDreadiness, start up and baseline setting costs which were obtained assecondary data. The second category was transaction cost incurredby villagers in terms of time and resources spent by householdsduring implementing REDD+ trial payments activities. They include;transaction costs of operation, preparation and cost of individualhouseholds in attending meetings. This was obtained by convertingnumber of days devoted for REDD+ activities in monetary termsusing the current government wage rate (TZS 6 818/=) per mandaythen, multiplied by the total time (days) invested in REDD+ activitiesmultiplied by number of households (Days X wage X number ofhouseholds). All costs to the project were obtained as secondary dataand were computed by using excel software and presented in the formof tables.
The REDD+ benefits were considered as all benefits obtained bythe local communities as a result of REDD+ trial payment scheme.They included; selling of forest carbon, construction of village office,Chabima primary school latrine and village dispensary, establishment of village land use plan sales of forest products and environmentalbenefits. The value of the forest products were obtained throughasking people the value of each forest product per unit and multipliedby the total number harvested per month. CBA was then done usingthe costs and benefits obtained. IRR was obtained through trial anderror. The guiding discount rate used to calculate NPV over time inthis analysis was 15%, 23%, 31% and 33.7%.
Results and Discussion
Identified transaction costs of REDD+ trial paymentscheme
Based on the clarifications made on section 2.4, the identifiedtransaction costs found on the REDD+ trial payment scheme in thestudy area are presented in Table 1.
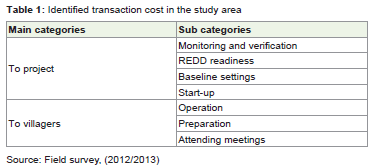
Table 1: Identified transaction cost in the study area.
The costs of participating in project activities
The cost of participating in various REDD+ activities byhouseholds in each village are given in Table 2.
The study revealed that about (73) days were spent by individualhouseholds in activities related to forest management for REDD+(Table 2). The higher number of days spent in forest management forREDD+ might be influenced by the length of time spent in carbonmeasurement and forest patrol. This imply that, forest managementactivities take up the greater part of time because they are continuousactivities and essential for maintenance of the forest resource. Theresults support argument made by Zahabu that carbon measurementcould be difficult and dangerous work as may involve walking fora long time in forest where risks of attack by wild animals such assnakes are possible [10].
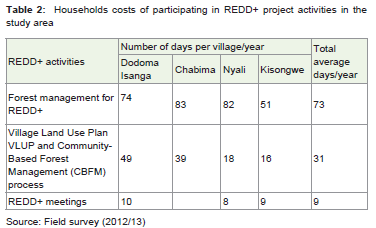
Table 2: Households costs of participating in REDD+ project activities in the study area.
However, the number of days spent by Chabima and Nyali villageswere high (83 and 82) days respectively (Table 2) in forest managementfor REDD+. Discussion with village leaders revealed that variation in number of days spent in REDD+ activities amongst villages mightbe influenced by the quality of their forest since the communitiesspent more time (i.e. more number of days) on maintenance oftheir degraded. This imply that communities in Chabima and Nyalivillages devoted more time in forest management activities becausetheir village forests were highly destructed as opposed to Kisongweand Dodoma Isanga villages. The findings support observations madeby Adhikari and Lovett that variation in transaction costs could becontributed by variation in forest conditions or in particular qualityof the forest resource itself [11].
Quantified annual transaction costs of REDD+ trialpayment scheme
costs incurred by villagers: The quantification of the cost ofparticipating in various REDD+ activities in monetary terms areshown in Table 3. From the results, transaction costs of forestmanagement for REDD+ is relatively high (TZS 497 714) due to highnumber of days spent on forest management for REDD+ (Table 2),compared to TZS 211 358 and 61 362 as transaction costs of VLUPand CBFM processes and REDD+ meetings respectively (Table 3).Moreover, there were differences between the transaction costsincurred between villages. For example, Chabima and Nyali villageshad incurred a more or less higher transaction cost of TZS 565 894 and 559 076 respectively in forest management for REDD+ asopposed to Dodoma Isanga and Kisongwe who had incurred (TZS504 532 and 347 718) respectively (Table 3). The reason for highertransaction costs, their variations and implications are the same asthose mentioned in section 3.2.
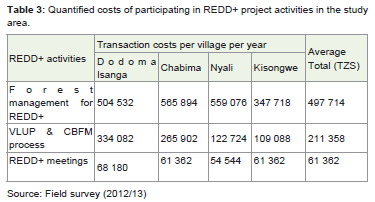
Table 3: Quantified costs of participating in REDD+ project activities in the study area.
Total transaction costs incurred by the REDD+ trialpayment project
The total transaction costs for a REDD+ project includestransaction costs incurred by project and transaction cost incurredby villagers (Table 4).
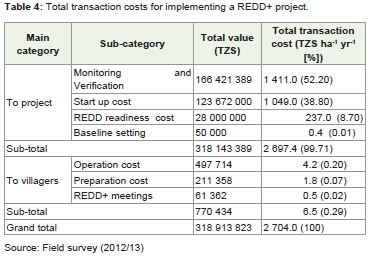
Table 4: Total transaction costs for implementing a REDD+ project.
The result implies that, higher transaction cost might beinfluenced by carbon pools covered, activities adopted for reducingdeforestation and/or forest degradation and monitoring methodsemployed. Average transaction cost of six Peruvian REDD+ projects(6 672 440ha) was estimated to be USD 0.73 ha-1 yr-1 [12], whichis equivalent to TZS 1 146 ha-1 yr-1. Based on the study findings ithas been argued with focus on economies of scale that REDD+transaction costs tend to increase with reduction of the project areaand carbon benefits [12].
Transaction costs incurred by the project are relatively high,rising to the equivalent of 99.71% of the total transaction cost asopposed to 0.29% incured by the villagers (Table 4). Again, it isapparent that costs for measurement, monitoring and verification arehigh constituting about 52.2% of the total estimated transaction cost(Table 4). The results are relatively similar to observations made byAntinori and Sathaye Antinori, C and Sathaye J [8] who found thatmonitoring and verification costs component have the largest rank (34%) of weighted transaction costs.
Economic efficiency of the project to offset transactioncost
CBA and sensitivity analysis were done, and results (Table 5)show that even at a discount rate of 31% the project was able to offsettransaction cost incurred during implementing REDD+ activities.However, the magnitude of the NPV decreases by 90% with increasein discount rate from 15% to 31%. The IRR was found to be 33.7%.This is the maximum interest that the project can pay to offsetproject costs and remain viable. The amount is higher compared tothe World Bank’s rate of 15% and the rate used by Tanzania’s Bankof 20.6%. This implies that the project is economically efficient.Moreover, the switching value approach shows that even when thebenefits were reduced by 90%, it was still viable. The REDD+ projectwould be inefficient when project benefits are reduced by more than90% (>90%).
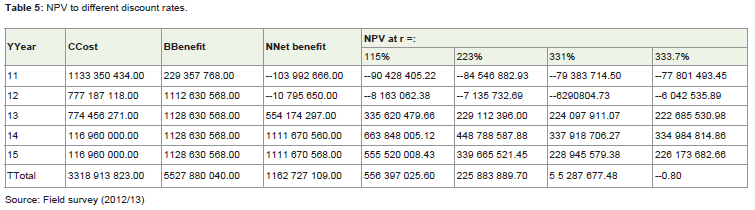
Table 5: NPV to different discount rates.
People’s perceptions towards REDD+ Trial Payments scheme
Perception on condition of the forest reserve after REDD+activities: Respondents in the study area were asked of theirperceptions on the changing trends of a series of indicators in the last3 years. The results of respondents’ judgments are given in Figure 2.
Majority of respondents (81.7%) had declared that there wasan increase on the number of vermin, wild animals and birds in theforest which destroy their crops in their farms; 15.8% reported nochange and 2.5% said it was decreasing (Figure 2). One respondent inKisongwe village said,
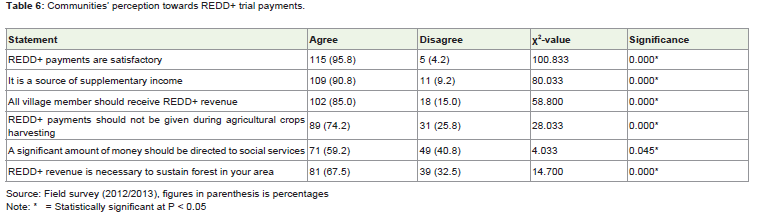
Figure 2: Responses on perception regarding condition of the village forestreserve.
“Forest conservation is good but when it comes to the issue ofvermin I hate it because I spend more time in a year chasing them toprotect my crops from being destructed”.
The result implies that, as the forest cover improves andbiodiversity values increase, so does the population of vermin, wildanimals and birds. This then might create costs to households suchas crop damage to the farms found nearby the forests. However,transaction costs of scaring vermin from the farms were not includedbecause such costs are incurred even without REDD+ activities.Experience shows that, crop damage is confined to villagers whocultivate adjacent to forest reserve [13]. It has been reported thatimproved conservation creates indirect costs to the household withfarms adjacent to protected forest [14].
On the other hand, 82.5% of respondents mentioned that therewas an increase in the forest cover, 15% mentioned that there were nochange and 2.5% said it was decreasing (Figure 2). The result showsthat, an increase in forest condition might be influenced by propermanagement of the forest as a result of REDD+ activities. The resultsimply that REDD+ initiatives had already shown its positive impactsto forest conservation in the study area. This might influence theincrease in amount of carbon harvested hence increased the earningsfrom REDD+ revenue. These results could provide information tosupport efforts of forest managers in the country on conservation.
Perception on amount of money received: A chi-square test onpeople’s perception on amount of money received was obtained usingsix statements (Table 6).
Table 6: Communities’ perception towards REDD+ trial payments.
Results show that 95.8% of the respondents agreed to theperception that REDD+ payments were satisfactory, implying thatit is worth to continue with similar payments. There is significantrelationship between communities’ perceptions on REDD+ trialpayments with their responses to agree or disagree at P < 0.05 level.However, observations on Makira REDD project in Madagascarevealed that people who directly benefited from the forestconservation did support it. Also it was suggested that ensuring fairdistribution of benefits from forest carbon project similar to REDDwould bring success in forest conservation [16].
Conclusions and Recommendations
The study concludes that most of the transaction costs(99.7%) were carried by TFCG-MJUMITA project for REDD+implementation. Although a tiny fraction of it is carried by villagersor communities implementing REDD+. The financial support tocover transaction costs of the pilot REDD+ project through TFCGMJUMITAwas essential in making it possible for REDD+ initiativesin Kilosa to be realized.
It is also worthwhile to undertake REDD+ project. The projectwas observed to be economically efficient and approaches used inundertaking it were perceived positively by communities under the project, particularly in terms income gain and also in sustaining theirvillage forests.
It is therefore recommended that in order to facilitateimplementation of REDD+ initiatives in the country, the governmentshould take responsibility to pay for transaction costs of REDD+projects. Villagers could only cover a tiny fraction of transactioncosts as observed in this study. Government intervention to pay fortransaction costs could ensure sustainability of forest conservationunder REDD+ particularly after donor support for such projects isended. This study revealed transaction costs (TZS 2 704 ha-1 yr-1 ≈USD 1.7 ha-1 yr-1) that should be covered.
Acknowledgement
Authors appreciate the financial support from the RoyalNorwegian Government through the Program on Climate changeImpacts, Adaptation and Mitigation (CCIAM). Staff members ofthe TFCG/MJUMITA Office in Dar es Salaam and Kilosa Districtthanked for their guidance on field study. A lot of thanks also go toall village leaders and all villagers in the study area (Dodoma Isanga,Chabima, Nyali and Kisongwe) for their willingness to respond onquestions during data collection.
References
- UNFCCC (2008) Report of the Conference of the Parties on its thirteenth session, held in Bali from 3 - 15 December 2007. FCCP/CP /2007/6/Add.1, Bonn, Germany. 4-13pp.
- Lee JA, Krister A (2011) Reducing Greenhouse Gas Emissions by Forest Protection, The Transaction Costs of REDD. NBER Working Papers No. 16756. National Bureau of Economic Research, Inc., Collorado, America. 15pp.
- Skutsch M (2004) Reducing carbon transaction costs in community based forest management. Climate Policy Journal 5: 433- 443.
- Pagiola S, Bosquet B (2009) Estimating the Costs of REDD at the Country Level. Forest carbon partnership facility, World Bank, Washington, DC, USA. 76pp.
- Lyimo E (2011) Making REDD Work for Communities and Forest Conservation in Tanzania. TFCG Technical Report No. 27. Dar es Salaam, Tanzania. 36pp.
- Ivan B, Maryanne G (2009) Incentives to Sustain Forest Ecosystem Services: A review and Lesson for REDD. Philadelphia, Pennsylvania. 393pp.
- Antinori C, Sathaye J (2007) Assessing Transaction Costs of Project-Based Greenhouse Gas Emissions Trading. Paper No. 57315. Ernest Orlando Lawrence Berkeley National Laboratory, Berkeley. 134pp.
- LTS/UNIQUE (2012) Estimating Cost Elements of REDD+ in Tanzania. A report prepared for the Ministry of Natural Resources and Tourism and the UN-REDD National Programme, Dar es Salaam, Tanzania. 112pp.
- Kajembe GC (1994) Indigenous Management Systems as a Basis for Community Forestry Tanzania: A case study of Dodoma Urban and Lushoto Districts. Tropical resource management Paper No. 6. Wageningen Agricultural University, The Netherlands. 15pp.
- Zahabu E (2008) Sinks and sources: A strategy to involve forest communities in Tanzania In global climate policy. Thesis for Award of PhD Degree at University of Twente, the Netherlands, 235pp.
- Adhikari B, Lovett JC (2005) Transaction costs and community-based natural resources management in Nepal. J Environ Manage 78: 5-15.
- Thompson O, Jouni P, John R, Julia P, Timothy R, Jorge T (2013). Reducing emissions from deforestation and forest degradation (REDD+): Transaction Costs of Six Peruvian Projects. Journal of Ecology and Society 18: 1-17.
- Meshak CK, Adhikari B, Doggart N, Lovett JC (2006) Transaction costs of community based forest management, empirical evidence from Tanzania. Afr J Ecol 44: 648-647.
- 14.Songorwa AN (1999) Community-based wildlife management (CWM) in Tanzania: Are communities interested? World Development 27: 2061-2079.
- Mialla YS, Kajembe GC, Malimbwi RE, Nduwamungu J (2004) Participatory and conventional forest assessment: A case study of Monduli Mlimani Catchment Forest, Monduli District, Tanzania. In: Proceedings of the IFRI-East African regional Conference on Institutions, Incentives and Conflicts in Forest Management, Moshi, Tanzania. pp. 69-79.
- Cynthia LR, Kazuhiro H, Mitsuru Y (2012) Forest resources use, attitude, and perception of local residents towards community based forest management: case of the Makira reducing emissions from deforestation and forest degradation project, Madagascar. Journal of Ecology and the Natural Environment 4: 321- 332.