Research Article
An Analysis of Relationship Between Nitrogen Surplus for Agriculture and Socio-Economic Properties: A Case Study for Turkey
Fethi Şaban ÖZBEK*
Joint Research Centre, Institute for Environment and Sustainability, Ispra (VA), Italy
*Corresponding author: Dr. Fethi Şaban ÖZBEK, Joint Research Centre, Institute for Environment and Sustainability, Ispra (VA), Italy, Ph: +39 333 1917803, Postal address: Via Fermi 2749, TP 266/023I-21027 ISPRA (VA), Italy, E-mail: fethiozbek@yahoo.com
Article Information: Submission: 15/04/2015; Accepted: 09/05/2015; Published: 15/05/2015
Copyright: © 2015 Fethi Şaban ÖZBEK, et al. This is an open access article distributed under the Creative Commons Attribution License, which permits unrestricted use, distribution, and reproduction in any medium, provided the original work is properly cited.
Abstract
This paper presents the analysis of relationship between nitrogen surplus for agriculture (NS) and some socio-economic properties among the regions of
Turkey for the period of 2007-2011. The correlations of NS with gross domestic product (GDP) per capita (0.66), permanent meadows and grassland share
in utilized agricultural area (UAA) (-0.55), population density (0.49), out-migration rate (-0.42), the export value of agriculture and forestry (0.35), illiterate
share (-0.31), number of villages (-0.31), arable land share in UAA (0.29), the value of livestock per capita (-0.26) and permanent area share in UAA (0.23)
were observed as statistically significant. A model was established by using C5.0 algorithm to define NS levels of the regions according to socio-economic
properties of the regions. According to the model results; permanent meadows and grassland in UAA, GDP per capita, population density, and illiterate share
were determined as the important variables to define NS levels of the regions. It can therefore be concluded that the permanent meadows and grassland
share in UAA and GDP per capita are the main socio-economic properties having noticeable effect on the environmental quality and human welfare related
to NS.
Keywords
Agriculture; Gross Domestic Product; Nitrogen Budget; Permanent Grassland; Turkey
Introduction
Ozbek and Leip [1] summarized the importance of nitrogen (N)
to living things as follows; nitrogen (N) is an important source of
nutrition for plants; while nitrogen deficiency negatively affects plant
growth, nitrogen surplus for agriculture (NS) can cause important
problems that affect environmental quality and human welfare [2-4]. These problems can be listed as negative effects on biodiversity,
eutrophication and nitrates accumulation in waters, acidification,
nitrous oxide emission, corrosion of ozone layer and risks to human
health due to exposure to nitrous oxide, ozone and particles [3,5].
The agricultural sector is defined as the main source of nitrogen
contamination in underground, surface and air levels [6-10].
There are many studies focused on the relationship between
environmental degradation and socio-economic properties, especially
the relationship between environmental degradation and income level [11-14]. An important number of these studies on this relationship
were about the environmental Kuznets curve (EKC). In literature,
there are limited number of studies on the relationship between NS
and socio-economic properties [15,16]. In these studies, only income
level was analyzed as socio-economic indicator. This paper will
ensure a great contribution to the literature in terms of examining the
relationship between NS and socio-economic properties among the
regions with different climates and socio-economic properties.
The NS values range vastly among the regions in Turkey [1]. The
socio-economic differences among the regions in Turkey, which is a
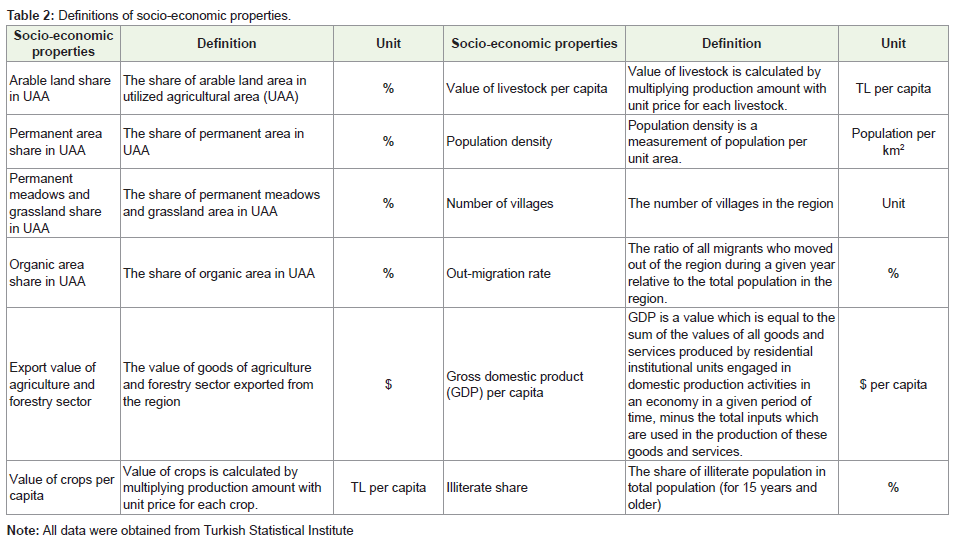
geographically big country, are also high. The purpose of this study is to
analyze the relationship between NS values and some socio-economic
properties (the number of villages, population density, crop patterns
(the shares of arable land, permanent area, permanent meadows and
grassland in utilized agricultural area (UAA)), organic area share in UAA, value of livestock per capita, value of crop products per capita,
the export value of agriculture and forestry, gross domestic product
(GDP) per capita, out-migration rate, illiterate share)among Turkey
Nomenclature of Territorial Units for Statistics (NUTS2) regions.
The correlation analysis between NS and socio-economic properties
of NUTS2 regions was carried out, and a model was established by
using C5.0 algorithm to define NS levels of the regions according to
their regional socio-economic properties.
Materials and Methods
The nitrogen budget methodology used in this study is based
on the methodology recommended in Eurostat/OECD common
guideline [17]. In this methodology, NS was estimated by using
equation 1.

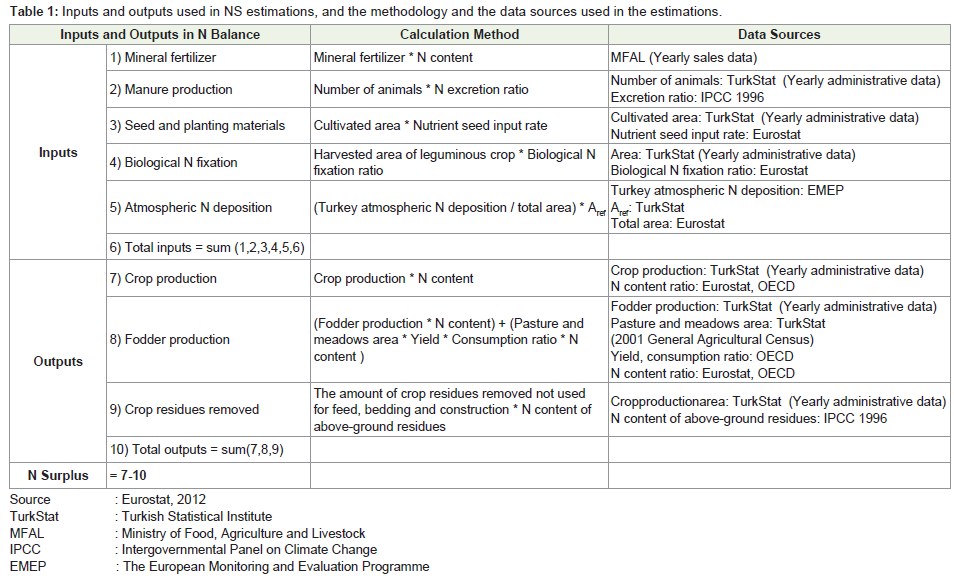
The reference area (Aref) is UAA (arable land, permanent crop
land, and permanent grassland). The inputs (Ninput) and the outputs
(Noutput) used in NS estimation, and the methodology and the data
sources used in the estimations of these inputs and outputs are
presented in Table 1. In order to minimize the impact of regional
differences in Turkey, where different climates are observed, NUTS2
division was used in the estimations [1,18].
A Pearson correlation analysis between NS and socio-economic
properties of NUTS2 regions was carried out by using SAS package
software. Turkey’s NUTS2 NS data from 2007-2011 was used in the
analysis. Socio-economic properties used in the analysis are presented in Table 2.
A model was established by using C5.0 algorithm to define NS
levels of the regions according to their regional socio-economic
properties. The analysis was carried out using SPSS Clementine 12.0
package software. The C5.0 algorithm is a new generation of Machine
Learning Algorithms based on decision trees, which is an important
model to realize the classification [19]. C5.0 model works by splitting
the sample based on the field that provides the maximum information
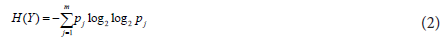
gain [20]. Information gain (IG(Y|X)) was calculated by using entropy
(H(Y)) (Equations 2 and 3) [21].
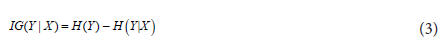
In these equations, pm is equal to P(Y=Vm), and it is supposed
that Y can have one of m values (V1, V2… Vm). H(YǀX) is the average
of H(YǀX=v)the entropies of Y among only those records in which X
has value v.
In C5.0 algorithm, the dependent variable is the target variable
that we are trying to understand and/or classify, and the input
variables are used for this aim. The input variables were determined
as socio-economic properties of the regions at NUTS2 level, and NS
was determined as target variable in this study. Target variable used in
C5.0 algorithm should be categorical. So that, the target variable NS in
numeric type was transformed to the symbolic type by grouping the
regions according to NS values. The regions were classified according to their NS values in four groups in a way that the interval of each
group was equal. These groups were denominated as low NS (L: NS<
21 kg N ha-1 yr-1), lower medium NS (LM: 21 kg N ha-1 yr-1< NS < 56
kg N ha-1 yr-1), upper medium NS (HM: 56 kg N ha-1 yr-1< NS < 91 kg
N ha-1 yr-1), and high NS (H: NS > 91 kg N ha-1 yr-1).
Regional GDP per capita and permanent meadows and grassland
data set of 2007-2011 period are absent for Turkey. So that, the
regional GDP shares for the year of 2000 were used in the analysis for
estimating regional GDP per capita values of 2007-2011 period. The
regional shares of permanent meadows and grassland in 2001 General
Agricultural Census were used for estimating regional permanent
meadows and grassland data set of 2007-2011 period. 2008-2011 data
set was used for out-migration rate and illiterate share in the analysis
as the data of the year 2007 for these properties are absent.
Results
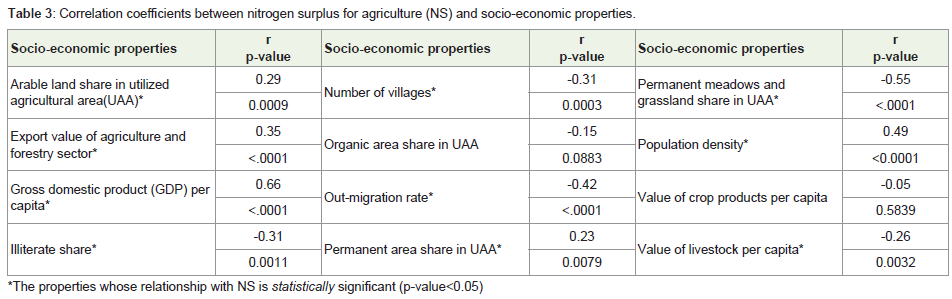
The correlations of NS with GDP per capita (0.66), permanent
meadows and grassland share in UAA (-0.55), population density
(0.49), out-migration rate (-0.42), the export value of agriculture
and forestry (0.35), illiterate share (-0.31), number of villages (-0.31),
arable land share in UAA (0.29), the value of livestock per capita
(-0.26) and permanent area share in UAA (0.23) were observed as
statistically significant (Table 3). The correlation coefficients of other
socio-economic properties were relatively low, and their relationships
with NS were not statistically significant.
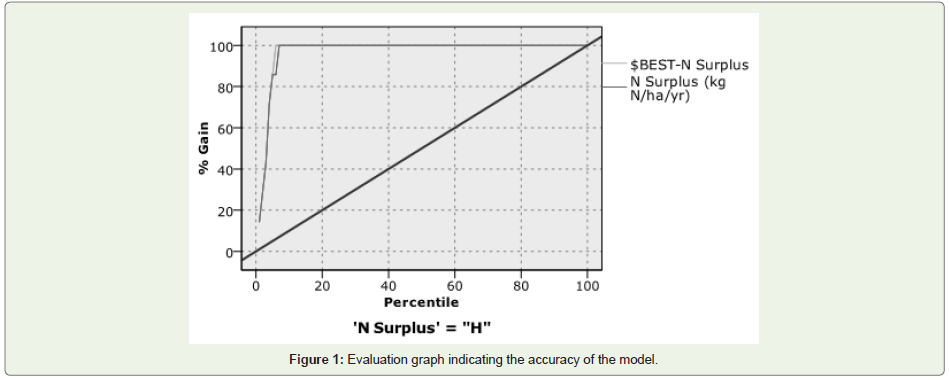
It is shown from the evaluation graph (Figure 1) indicating the
accuracy of the model formed by using C5.0 algorithm that the best
line and the model line are very close to each other. This shows that
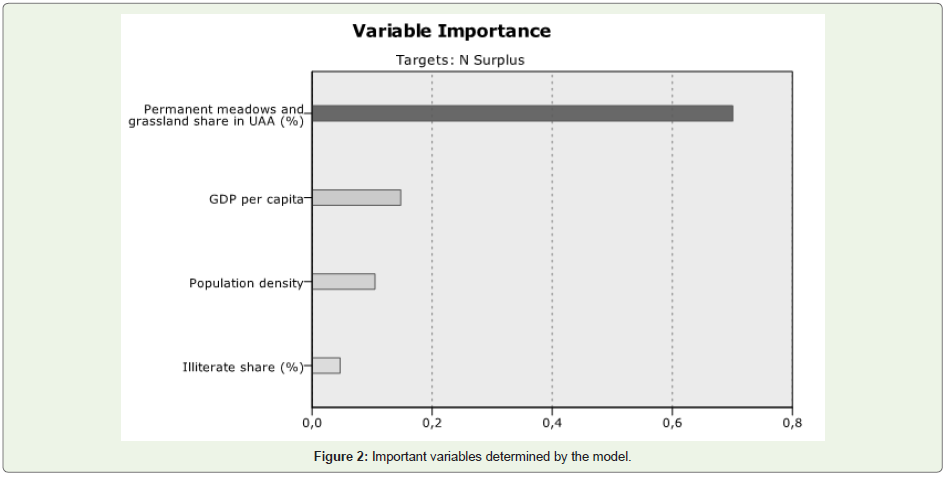
the model has high accuracy. The analyse accuracy ratio of the model is so high as 97.28%. According to the model results,permanent
meadows and grassland share in UAA, GDP per capita, population
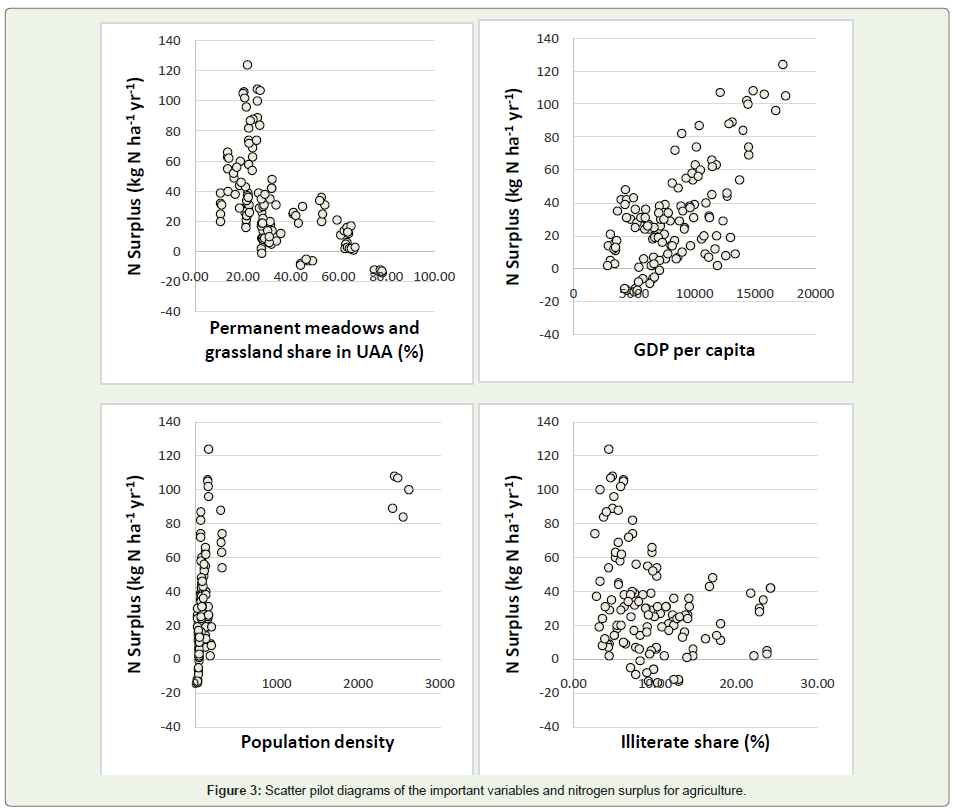
density, and illiterate sharewere found as important variables (Figure 2). The scatter pilot diagrams of the important variables and NS are
presented in Figure 3.
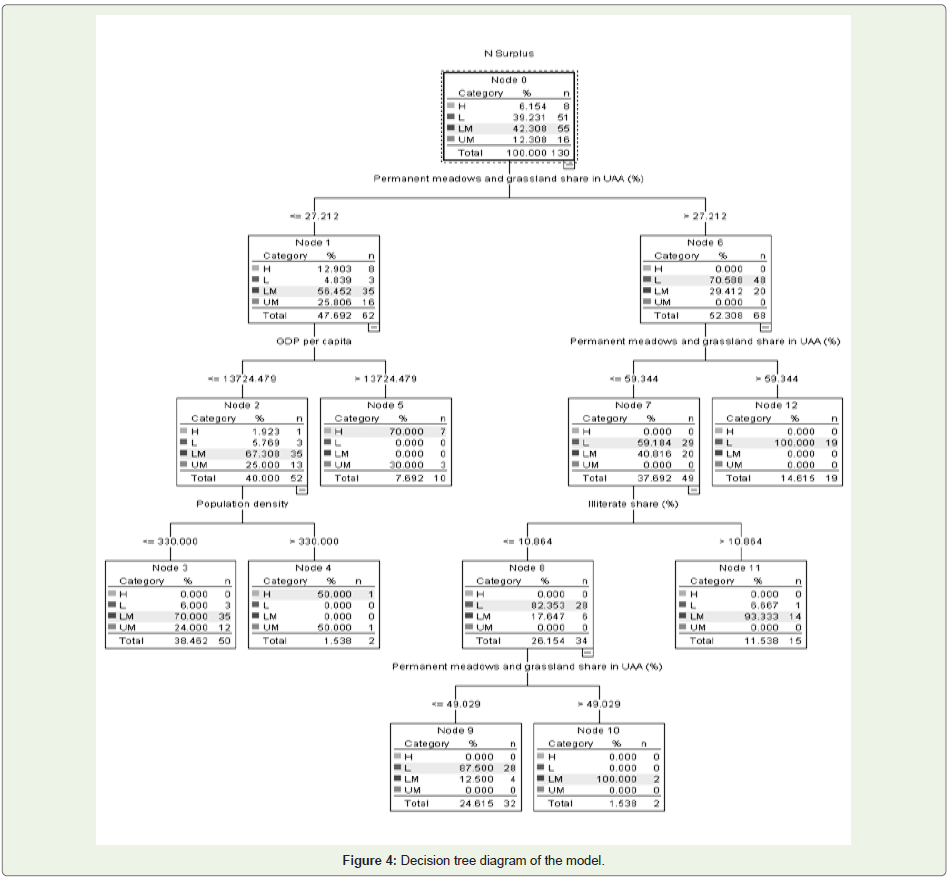
The first split of the decision tree was based on permanent
meadows and grassland share in UAA. The following split was based
on GDP per capita. In case permanent meadows and grassland share
in UAA was lower than 27%, the following split was based on GDP
per capita. In this case, if GDP per capita was higher than a definite
value (13724$) NS was observed high, otherwise it was relatively low.
It was also observed that the regions with low permanent meadows
and grassland share in UAA, low GDP per capita, and lowpopulation
density had relatively low NS (Figure 4).
All of the regions with permanent meadows and grassland share
in UAA were higher than 59% presented in low NS group. The
regions with permanent meadows and grassland share in UAA was
between 27% and 59% were divided in the following split according to
the illletrate share. It was observed that the regions with lower illterate
share had relatively lower NS (Figure 4).
Discussions
In the regions with high GDP per capita, population density and
arable land share of Turkey, where intensification level in agriculture
was also high, hence mineral fertilizer usage was high; it was observed
that the NS values were also high. The reverse relationship of NS with
permanent meadows and grassland can be explained as follows; in the
regions of Turkey, where permanent meadows and grassland were
high, the extensification level in agriculture in these regions was also high. Therefore, mineral fertilizer usage was low; it was observed that
NS values of these regions were relatively low.
It was shown that the relationship between environmental
degradation and income level was the form of inverted U. The
relationship between N surplus and GDP per capitain this study was
similar to that curve (Figure 3). This indicates us that the relationship
between N surplus and GDP per capita ensures EKC curve similar
to some environmental issues (eg. SO2 emission [22]; suspended
particulate matter, total deforestation etc. [11]. This result is also
parallel to the study made by Shen et al. [15] and Zhang et al. [16]
showed the pollution from NS and economic growth relationship
followed an inverse-U shape.
All the regions with permanent meadows and grassland shares
in UAA were higher than 27% in the group of low NS or low
medium NS. This indicates us that the regions / countries with high
permanent meadows and grassland shares have relatively lower NS.
12 of EU countries with permanent meadows and grassland shares in
UAA was higher than 27% had low or low medium NS [23] similar
to the model results in this study (Figure 4). But, 5 of EU countries
had upper medium or high NS. It is a fact that the regionalisation
of NS estimations gives more sound results compared to the nonregionalisation
estimations. Therefore, the most important reason
for the bias is the non-regionalisation of NS estimations in Eurostat
methodology. The model shows us that the more GDP per capita the
more NS for the regions. The GDP per capita has increased in TR in
recent years [24]. It was speculated that in the future if current trends
in GDP growth continue the environmental risks related to NS can
increase.
Although the effect of population density and illiterate share
on the NS were relatively low compared to the effect of permanent
meadows and grassland share in UAA and GDP per capita, some
indirect relationships were observed between these properties and
NS. According to the model results, the NS values of the regions with higher illiterate shares and lower population density were higher
than the NS of the regions with lower illiterate share and higher
population density. It was also observed from the model that the
more population density the more NS for the regions (Figure 4). The
direct relationship of NS with population density and the inverse
relationship of NS with illiterate share can be explained as follows; in
the regions where population densities were low and illiterate shares
were high, the extensification level in agriculture was also high and
consequently low mineral fertilizer usage, hence NS values of these
regions were relatively low [18]. It was therefore speculated that the
regions with low population densities and high illiterate shares have a
low risk for environmental degradation related to NS in comparison
to other regions.
Although NS is not only one or main indicator for measuring
environmental degradation, it is well known that nitrogen surplus
can cause important problems that affect environmental quality and
human welfare [25]. It can therefore be concluded that the permanent
meadows and grassland shares in UAA and GDP per capita are the
main socio-economic properties having the noticeable effect on the
environmental quality and human welfare related to NS.
References
Citation
ÖZBEK FŞ. An Analysis of Relationship Between Nitrogen Surplus for Agriculture and Socio-Economic Properties: A Case Study for Turkey. J Environ Soc Sci. 2015;2(2): 109.