Research Article
Impact of Multivariate Risk Factors on Children’s Health in Ekaterinburg: A Cross-Sectional Study
Ekaterina Konstantinova1* and Anatoly Varaksin2
1Senior Researcher at laboratory of Mathematical Modelling in Ecology and Medicine, Institute of Industrial Ecology, Ural Branch of Russian Academy of Sciences, S. Kovalevskaya Street, 20, 620990, Ekaterinburg, Russia
2Doctor of Sciences (Physics and Mathematics), Head of Mathematical Modeling Laboratory in Ecology and Medicine, Professor Institute of Industrial Ecology, Ural Branch of Russian Academy of Sciences, Ekaterinburg, Russia
*Corresponding author: Ekaterina Konstantinova, Senior Researcher atlaboratory of Mathematical Modelling in Ecology and Medicine, Institute of Industrial Ecology, Ural Branch of Russian Academy of Sciences, S. Kovalevskaya Street, 20, 620990, Ekaterinburg, Russia, Work ph. +7(343) 3623514; Fax: +7(343) 3743771, E-mail: konstantinovaekateri@gmail.com
Article Information: Submission: 16/03/2015; Accepted: 31/03/2015; Published: 05/04/2015
Copyright: © 2015 Ekaterina Konstantinova, et al. This is an open access article distributed under the Creative Commons Attribution License, which permits unrestricted use, distribution, and reproduction in any medium, provided the original work is properly cited.
Abstract
Background: The study was undertaken to assess the multifactorial environment impact on human health in large industrial city. Our objective was to
look for the risk factors complex that has the greatest impact on the prevalence of diseases.
Methods: A cross-sectional epidemiological study was performed with a representative sample of 441 preschool-aged children. Classification Tree
method was used as the main research method.
Results: Our study showed that the complex of ecological risk factors (air pollution, drinking water pollution, a gas stove in the apartment, etc.) increases
the prevalence of diseases of the respiratory system and behavioral disorders from 2.5 to 4 times coupled with the socialeconomic risk factors.
Conclusions: This study shows that such factors as atmospheric pollution, gas-stove in apartment, parent smoking and mother’s low educational
attainment increase the prevalence of diseases even in terms of univariate approach. The authors have identified also risk factors sets having a maximum
negative influence on the prevalence diseases.
Keywords
Children health; Indoor and outdoor air pollution; Cross-sectional study; Multivariate risk factors analysis; Classification trees
Introduction
Within the framework of the modern paradigm of
noncommunicable diseases epidemiology, in contrast to the
epidemiology of infectious diseases, we deal with the so-called “the
web of causation”, and not with relatively simple connections “cause -
effect” [1]. “When many factors act together, it has been called ‘the web
of causation.’ A causal web is well understood in chronic degenerative
diseases such as cardiovascular disease and cancer” [2,3]. “One of the
characteristics of most non-infectious diseases is that many different
factors contribute to their development and can be said to be causes
in the sense that, in their absence, the incidence of disease is reduced
and that, in their presence, the incidence is increased” [4]. Because
human health is determined by the simultaneous action of multiple risk factors, (including environmental, social, family, etc.) on the
organism, the assessment of their actions should be carried out in
complex [5-8]. Thus, multivariate analysis aims to identify those risk
factors combinations that have the greatest impact on public health.
Modifiable (those that can be changed) and non modifiable
risk factors of health loss can be identified among all risk factors.
Environmental pollution (environmental risk factors), for example,
refers to the unmodified ones (people cannot change the environment
in their habitat), whereas some family, behavioral, or social factors
are largely modifiable ones (they can be partially or completely
eliminated by changing the family “Settings”, giving up bad habits,
etc.) [6,9,10,11].
The authors propose to develop a subject-oriented statistical model describing multifactorial environment impact on human
health. The proposed model is based on discriminant analysis. What
is a subject-oriented approach? Subject-oriented approach should
have the following features: all its stages should be apparent to those
skilled in the subject area and it should produce results that would be
important not only for academics but also for practical science e.g.,
human ecology and epidemiology).
Application of discriminant analysis methods to the problem
of risk factors impact on health is based on one idea. The idea is
as follows: a set of predictors that can reliably classify patients and
healthy individuals is the set of risk factors that has the greatest
influence on the disease occurrence [12-14].
Discriminant analysis methods have not yet found wide
application in problems of risk factors influence on disease prevalence.
The reason for this is as follows. The decision rule constructed by
any classification method should reliably distinguish the sick from
the healthy. In other words it should be “the high quality decision
rule” that gives a high percentage of correct classification. It is
fundamentally impossible to get a reliable decision rule in problems
related to the risk factors influence on the population health, because
risk factors only increase the likelihood of disease, but do not cause
disease. Therefore, the presence of a complex (even a large number
of risk factors), cannot guarantee the disease occurrence (as well as
the absence of risk factors does not guarantee the absence of disease).
Consequently, it is also impossible to accurately predict the disease
occurrence using a mathematical description based on the knowledge
of risk factors [13-17].
Among the classification methods, let us distinguish the “black
box” models (neural networks, pattern recognition techniques) that
form the decision rule as an algorithm that is not available for the
subject analysis. Several methods (linear discriminant function,
logistic regression) give a decision rule in a form that is accessible
to the subject analysis.The disadvantage of these methods is that
their performance is only for unrelated risk factors (uncorrelated
predictors) [14,18-21].
The authors show here that the CT method has features. The first
is the possibility to apply this method for correlated predictors. The
second is using a decision rule that is not of high quality, which does
not necessarily clearly distinguish the sick from the healthy patient,
but allows dividing the population into groups with higher and lower
prevalence of disease.
Materials and Methods
A study was conducted on a sample of Ekaterinburg preschool
children. Ekaterinburg is the fourth-largest city in Russia (after
Moscow, St. Petersburg, and Novosibirsk), with a population of about
1,425,000 (2012) and land area of 491 sq. km. Ekaterinburg is situated
in the middle of Eurasia on the border of Europe and Asia.
It is worth stating that the geographical location of Ekaterinburg
is extremely favorable and eventually this fact influenced the
development of the city. The city is located in the Urals where the mountains are low; this fact favored the construction of main
transportation ways from Central Russia to Siberia through
Ekaterinburg (Bolshoi Siberian road, Trans-Siberian railway). As a
result, Ekaterinburg was formed as a strategically important center
of Russia providing connection between European and Asian parts
of the country. Moreover, our city is strategically important center of
Russia providing connection between European and Asian parts of
the country nowadays.
It is the third (after Moscow and Saint-Petersburg) largest
transportation juncture where six federal highways and seven railways
meet. The city is an important transport and logistics juncture on the
Trans-Siberian railway, as well as a large industrial center.
Data on the prevalence of various diseases and the presence of risk
factors were obtained at routine medical inspections in the sixteenth
municipal Children’s hospital [22]. Totally, 441 preschool children
attending nursery schools were examined at Zheleznodorozhny
district of Ekaterinburg. Comprehensive database contains
information on about 100 various (ecological, social, family, etc.) risk
factors (RF) collected using parents questionnaires. RFs that are not
widespread (rare factors) were excluded from the study during the
preliminary analysis. RFs that have not demonstrated any connections
with studied diseases in terms of univariate approach were excluded
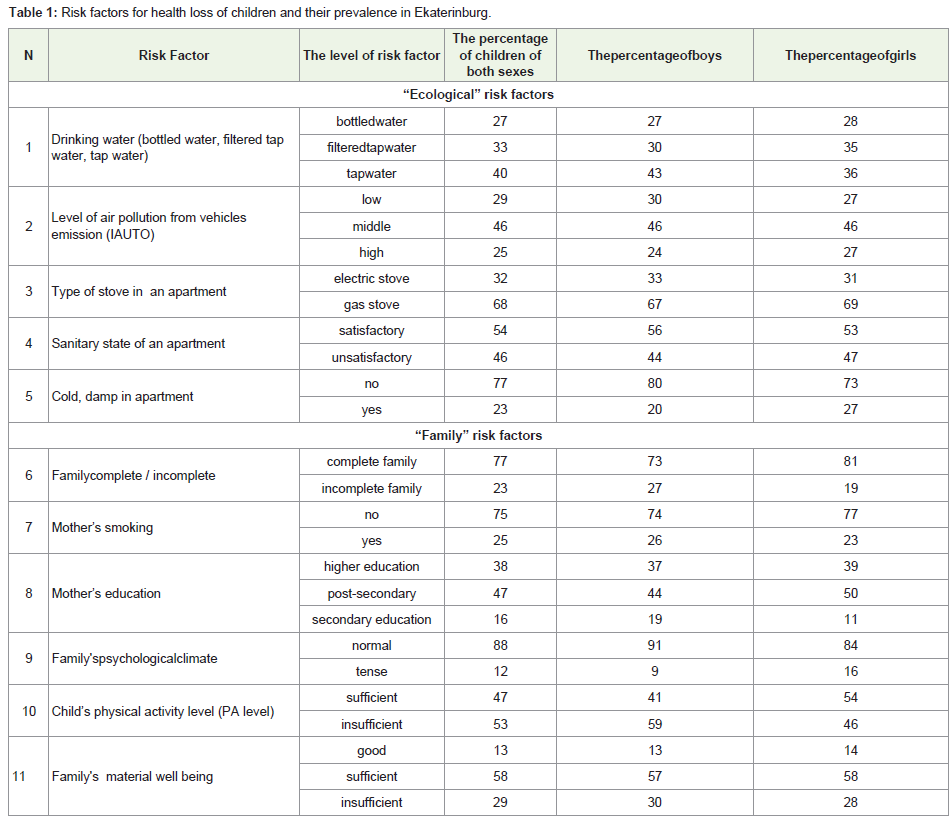
from the study also. Ultimately, 11 most significant and widespread
RFs were selected for the final analysis of their influence on children’s
health (Table 1). Among them were outdoor air pollution, drinking
water quality, gas stove usage, secondhand smoke, physical inactivity,
low education level of mother, bad habits of parents, etc. [22].
Let us analyze the prevalence of RFs (Table 1) and let us start with
the environmental RFs. The drinking water types presented in our
study comprise three gradations: special bottled water, filtered tap
water, and tap water. Data from the Table 1 show that that 40% of
families having preschool children use tap water without cleaning for
cooking (moreover, the percentage of such families in boys (43%) is
higher than in girls (36%)).
Tap water in Ekaterinburg is characterized by the presence of
organochlorine compounds, lower fluorine content, and is iodine
deficit. Herewith, it is revealed that consuming chlorinated drinking
water has hepatotoxic effect, i.e. it might possess a potential for
carcinogenicity and mutagenicity. It is also revealed that lower
fluorine content leads to high caries rates. The iodine deficiency in
some cases is known to cause development of congenital anomalies
and reduction of cognitive abilities in children and adults [23]. Only
27% of families buy special bottled water for cooking.
The level of air pollution from vehicle emission (the authors
will use abbreviation ‘AUTO‘ thereafter) is presented in our study
through three gradations: low (is denoted as -1), middle (is denoted
as 0), and high (is denoted as +1). The data in Table 1 show that 25%
of children attend nursery schools located in the areas with high levels
of air pollution and 46% of children attend nursery schools located
in the areas with middle levels of pollution. So only 29% of children
analyzed in this study, attend nursery schools located in the areas
with relatively clean air.
Gas stove in an apartment where the child lives is the next ecological RF. Gas stove (compared with electric one) is a wellknown
RF of children’s health loss. The authors found in our study
that 68% apartments in Zheleznodorozhny district of Ekaterinburg
are equipped with gas stoves. The prevalence of unsatisfactory
sanitary state of the apartments and prevalence cold and mold in the
apartments are 46% and 23%, respectively.
We now proceed to the social and domestic RFs. The authors
mean such socioeconomic factors, as educational level, family’s
material well-being, and the family’s psychological climate to these
factors too. Data about their prevalence are given in Table 1 too.
Most families (77%) that are complete can be estimated,
certainly, as not being a RF. Table 1 demonstrates that such RF as
“Mother’s smoking” is spread in 25% of cases and 75% of mothers
are nonsmokers.
Table 1 demonstrates that such RF as “Mother’s smoking” is spread in 25% of cases and 75% of mothers are nonsmokers. Low
education level of mother (only secondary education) is a RF too.
Table 1 demonstrates that this RF is presented in 16% of families. In
47% of cases, mothers have postsecondary education and in 38% of
cases, higher education. High level of education is regarded in our
study as the absence of RF. However, it cannot be stated definitely
that the absence of mother’s higher education is the predictor of
adverse child health indicators. Nevertheless, mother’s education can
indirectly affect life and living conditions of the family (e.g., more
educated people probably are less likely to smoke in the presence of
a child).
Our results demonstrate that along with the degree of family’s
material well being, notable sociobehavioral roles played in the
household are a factor in the children’s health. Among these factors
family’s psychological climate and the character of leisure time and
rest are substantial. An overwhelming majority of families (88%) have normal (not tense) psychological climate. Slightly less than half of
the children (47%) have sufficient level of physical activity (sports or
physical activity with family) that should positively affect their health.
It can be seen (Table 1) that 29% of families having preschool children
estimate their family’s material well being as insufficient; 58% of
families estimate their family’s material well being as sufficient, and
13% as good.
The interesting thing is that predictors that can be attributed
as modifiable and manageable proved to be quite common and
statistically significantly influencing RFs. It is generally known
that there are modifiable RFs (ones that you can change) and non
modifiable RFs (ones that you cannot change). Modifiable RFs
include lifestyle, eating habits, bad habits of parents and children, that
is, all that can be potentially changed or eliminated. Our results show
that substantial benefits for children’s health are: parent’s smoking
refusal when children are present; sufficient physical activity of child;
satisfactory state of apartments, and creation of normal psychological
climate in the family. All these steps are quite feasible for parents.
Such RFs as type of stove in an apartment or type of drinking water
can be classified as partly modifiable and requiring some material
spending. Nevertheless, these RFs can be eliminated if parents wish
in contrast to such resistant environmental factor as atmospheric air
pollution in a large industrial city.
Calculation of air pollution from vehicles emission Index AUTO:
As air pollution index for each child, the authors take the level
of atmospheric air pollution from vehicles emission in territories
where a child spends quite a long time. These are: playing field in
nursery school and the area where the child lives. As it is not exactly
known how much time a child spends near his home and whether the
child spends it there at all, the authors have refused to estimate the
influence of vehicles emission around place of residence. The authors
assessed the level of air pollution in the playing field in the nursery
school according to the next scheme. Firstly, the authors investigated
traffic at the roads and crossroads near the nursery schools. As a
result, the authors found data about the number of vehicles as well
as different types passing on certain roadsper unit time and about
number of vehicles at the crossroads. Then, based on this information
the authors estimated gross emissions from all vehicles on major
roads and crossroads located at a distance less than 200 meters from
the nursery school per unit time. Herewith, lines (road) are treated
as linear sources of emissions and crossroads are treated as points. In
this case, the level of emission at the investigated point is determined
as the sum of emissions from all nearest sources taking into account
atmospheric scattering. The authors describe scattering (the reducing
of the emission level with increase of distance from the emission
source) by exponential law. To clarify the calculations, the authors
use an expert coefficient considering buildings and some features of
the area adjoining the investigated point. These are objects protecting
from the influence of road or crossroad emissions (buildings, shrubs,
fences).As a result the air pollution index, (expressed as a continuous
variable), is connected with each nursery school, and, consequently,
with each child.More details about the calculation of gross emissions and methods of assessment of air pollution in a particular area have been
published previously [24].
For ease of use, the air pollution indexes should be converted in
the qualitative form with a small number of gradations. To do this,
the authors introduced the “load from auto transport” index (denoted
as IAUTO).This index allows dividing studied territories, and,
consequently, to divide the studied children’s population into three
groups (with low level, middle level, and high level of auto transport
load or “IAUTO”). Consequently, nursery schools divide into three
groups too: with low IAUTO, middle IAUTO, and with high IAUTO.
For example, nursery school №32 with low IAUTO is located
at a distance of 210m from the only auto road with low traffic (380
vehicles per hour on average).
As to nursery school №369, which fell into the third group
with “high IAUTO”, it has three sources of emissions in nearest
neighborhood. So, nursery school №369 is located 10 m (only!) from
auto road with traffic of 1020 vehicles per hour; the same nursery
school is located 50 m from the second road with traffic of 870
vehicles per hour; and, finally, it is located 140 m from the third road
with traffic of 560 vehicles per hour.
The analyzed diseases:
The upper respiratory tract diseases, diseases of the circulatory
system (International Classification of Diseases (ICD)-10, chapter IX),
diseases of the musculoskeletal system and connective tissue (ICD-
10, chapter XIII), and behavioral disorders (ICD-10, chapter V) are
selected in this study as analyzed diseases. The upper respiratory tract
diseases (relating to “Diseases of the Respiratory System”, according
to ICD-10, 10th Revision, chapter X) include ethmoiditis, rhinitis,
hypertrophy of the tonsils, tonsillitis, and adenoiditis. Behavioral
disorders among the preschool children (relating to “Mental and
behavioral disorders” according to ICD-10, 10th Revision, chapter V)
include most often sleep disorders, enuresis, dyslalia, and common
speech disturbance. The authors denote class of diseases using the
letter D and the index numbers of the ICD-10 chapters.Statistical methods:
Classification Tree method was used as the main research method
(Breiman et al, 1984). The specificity of this method is the ability of
constructing subject-interpreted (or subject-oriented) decision rules,
which allow selecting the most significant RFs complex for health loss
in children [15].An algorithm for constructing and analyzing the classification tree:
Among a variety of specific implementations of classification
trees, the authors propose the following algorithm for constructing
the classification tree. The implementation of this algorithm will be
shown below on the specific examples.1. Ranking risk factors by largest univariate effectΔW: In
investigating the impact of RFs on population health, the univariate
effect is traditionally understood as the difference between:
ΔW=W (RF is present) – W (RF is absent), (1)
Where W (RF is present) is the prevalence of disease in the
population group that are exposed andW(RF is absent) is the
prevalence of disease in the population group that are not exposed to
that RF, (respectively).
First splitting: The building of a decision tree starts at the root
node, which includes all children in the study sample, and which is
characterized by the number of children in the sample n1 and the
prevalence W1 of the study disease. The first splitting is made by the
RF (from the list in Table 2), which gives the maximum univariate
effect (1). As a result, the root node is divided into two nodes № 2 and
№ 3 (binary split algorithm), which are characterized by the number
of children n2 and n3, and the prevalence of the study disease W2 and W3, respectively. According to the above, W2 and W3 differ maximally
among all the possible variants of branching.
Repeated splittings: An attempt to divide each of the nodes № 2
and № 3 (that have been received in the first stage) into two new nodes
with other RFs using the same principle (the branching procedure) is
made at this stage. If the node is not divisible, it is called a terminal
(final) node.
Stopping rules: There are mainly three ways to stop the branching
algorithm:
• reaching a state where no further splitting of a node leads to a
significant change in W;
• reaching a set number of branching levels;
• reaching a minimum number of cases or objects in a node.
In this study, the authors use (in one way or another) all ways of
stopping the branching. Therefore, stopping branching by reaching
a state where no further splitting of a node leads to a significant
change in W is shown in Example 1 in the Results section. Reducing
the number of objects in the nodes after each branching leads to the
inability of further branching in some nodes (the number of objects in
these nodes becomes too little). An example of stopping branching by
this rule is shown below in Example 2. The number of risk factors in
the model is directly or indirectly determined by the number of levels
of branching. The number of factors in a subject-oriented statistical
model allowing for a substantive interpretation should not be large
(3-4 factorsare enough).
After ending the procedure of branching, all nodes become leaves or terminal nodes. Here, it is not necessary that each terminal node
should contain only objects belonging to the same class (only sick
or healthy only). It is sufficient that objects of the same class are
dominated in the presence of objects of another class.
Forming groups with low and high value of pathology prevalence (W): To solve the problem of the impact of risk factors on
population health using Classification Tree method, it is necessary to
form population groups with low value and high value of pathology
prevalence. For this, from all terminal nodes, we have to select those
in which the value of pathologies prevalence is maximal and minimal
(the selection is realized expertly). Groups with low and high value of
W will be formed from these nodes.
Formulating subject-oriented decision-rules: Decision rules for the description of groups with high and low values of pathology
prevalence. These rules are formulated by analyzing tree branches
leading from the root node to each terminal node included in the
groups (the authors have in mind groups with a low and a high value
of pathologies prevalence). The authors use low-quality decision rule,
which is not necessarily clearly distinguished from a healthy patient,
but allows us to divide the population into groups with higher and
lower diseases prevalence. Below are examples illustrating this stage
of the algorithm.
Analysis of those terminal nodes not included in the decision rule: Terminal nodes that are not included in the decision rule
provide important information about the possibility of compensating
the negative effects of some risk factors by the lack of action of others.
Recommendations for the health protection: The resulting
decision rule allows us to formulate recommendations for the
population health protection understandable not only to scientist,
epidemiologist, but also to practical public health specialists.
Results
Considered the application of the classification trees method to
solve some specific problems.
Risk factors for the respiratory system diseases (Example 1):
Consider the problem of searching the complex of RFs
maximally influencing the respiratory diseases among Ekaterinburg
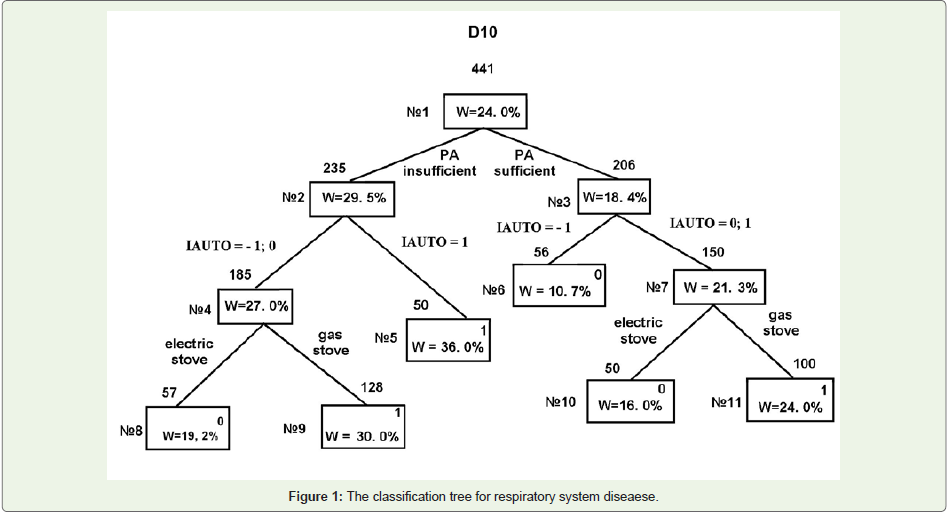
preschoolers. The problem is solved by constructing and analyzing a classification tree using the algorithm described above in Section 3 (Figure 1).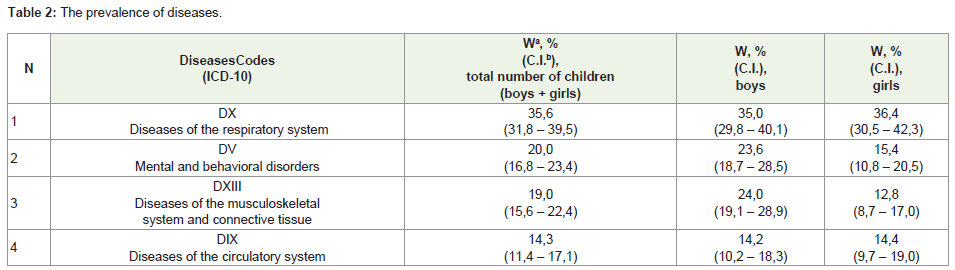
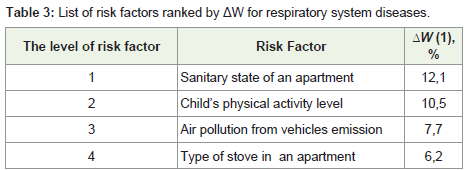
Ranking risk factors by largest univariate effect ΔW: There are 441 children in the studied sample of Ekaterinburg preschool children (see “Materials and Methods”). Initially, all children in the sample are attributed to the root node (the node № 1 in Fig. 1). N1 = 441 above the root node corresponds to the volume of the sample (the number of children); W1 = 24, 0% corresponds to the prevalence of respiratory diseases in a sample of 441 children. We conduct ranking of RFs by largest univariate effect ΔW (1). The results are shown in the Table 2.
First splitting: For the first splitting, we should choose a RF with
the largest value of ΔW as described in section 3 of the algorithm.
In this case, the factor is “The sanitary state of an apartment.”An
attempt to split our sample by means this RF shows that children
were disproportionately divided into two groups: 404 children in the
group with satisfactory sanitary state of an apartment and a very small
group of 37 children in the group with unsatisfactory one. Obviously,
the group of 37 children cannot be used for further branching and
therefore factor “Sanitary state of an apartment” is not suitable for
the first branching.
In such a case, we choose next RF from Table 2 for the first
branching. This factor is “Child’s physical activity “. This factor has
two levels: sufficient activity and insufficient activity. Insufficient
activity is considered as a RF to increase the probability of the disease.
Consequently, in terms of “Classification tree method”, dividing the
sample into children having sufficient activity and children having
insufficient activity allows one to get two groups of children with
maximum different values of prevalence of respiratory system
diseases (W2 = 29,5% for n2 = 235 children and W3 = 18,4% for n3 = 206 of children; n2 + n3 = n1= 441).
Dividing of sample by only one RF gives the relative risk RR = W2/
W3 = 29, 5 / 18, 4 = 1, 60 (Confidence Interval 1.1 – 2.2). Continuation
of branching should lead to an increase in Relative Risk.
Repeated splittings: Each of the two nodes obtained at the first
branching (node №2 and node№3) can be divided by the same principle
(the maximum differences of W in the two obtained groups). The
node № 2 is divided by the RF “Air pollution from vehicles emission”.
Children attending nursery school located in low-quality air zone
(IAUTO = +1) get terminal node № 5. This node corresponds to a
sample of children with very high prevalence of respiratory system
diseases W5 = 36, 0%.Another node (node №4; IAUTO = –1 и 0) is
not a terminal one and the next stage of classification tree building
this node is splitted by the factor “Type of stove in an apartment.” As
a result of this dividing we obtain two terminal nodes (№8 and №9);
therefore, splitting of this branch of a tree is ended. One of these
two terminal nodes (node № 9) corresponds to a group of children
with a high prevalence of pathology D10 (W9= 30, 0%), whereas, the
second (node № 8) corresponds to a group of children with a value of
prevalence W8= 19, 2%, close to the original W1 = 24, 0%.
Node №3 (as well as node №2) is split by the RF “Air pollution
from vehicles emission” but this node is split by other gradations of
RF. Children attending nursery schools located in the high-quality air
zone (IAUTO = -1) get to terminal node №6. This node corresponds
to a sample of children with very low prevalence of pathology D10
(W6 = 10, 7%). Node №7 is not terminal and the next stage of the
tree building this node is divided by the factor “Type of stove in a
apartment.” As a result of this dividing, we obtain two terminal nodes
(№10 and №11).One of them (node № 10) corresponds to a group of children with an intermediate prevalence of pathology D10 (W10=
16, 0%), whereas, the second (node № 11) corresponds to a group of
children with a value of prevalence W11= 24, 0%, equal to the original
W1 = 24, 0%.
Stopping of branching: Nodes № 5, 6, 8, and 10 are considered as
terminal, as the number of children in these nodes is rather small (50-
60 children). Further branching of these nodes will lead to nodes with
very small number of objects, so any conclusions will be statistically
insignificant. Nodes №9 and №11 are “perspectiveless” for further
branching, as no factors from the remaining ones are able to divide
these nodes with a significant increase (or decrease) of value W,
compared to W9 and W11.
Expert forming groups with low and high value of pathology prevalence (W): Having assessed the value of disease prevalence in
each of the terminal nodes, we, as experts, form groups with “low”
and “high” value of the prevalence (W). In our example, the group
with the “low” value of the diseases prevalence (W) is formed from
nodes №6 and node №10, and the group with “high” value of W is
formed from nodes №5 and №9. Terminal nodes W values that are
close to the average value of the sample (W1 = 24, 0%) do not get into
these groups.
Formulating subject-oriented decision-rules: Analysis of
the “way” that leads from root node to each of the terminal nodes,
forming a group with low or high W, allows us to formulate subjectoriented
decision rules. Analysis of the way to nodes № 5 and 9,
allows us to formulate following the decision rule. A child gets to
a group with a high prevalence of respiratory diseases in two cases.
The first case: RF “Physical inactivity” (node №2 is obtained from the
node №1) in combination with attending a nursery school in lowquality
air zone (node №5 is obtained from the node №2). The second
case: combination the same RF “Physical inactivity” with gas stove in
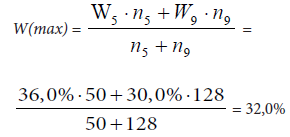
the apartment (node №9 is obtained from the node №4). In general,
two terminal nodes №5 and №9 include 178 children; the average
prevalence of respiratory system diseases among them is:
Having analyzed the way to the nodes №6 and 10, we obtain the
decision rule describing low-prevalence respiratory diseases group.
This is the physical activity of a child in combination with attending
a nursery school in high-quality air zone; or in combination with
electric stove in an apartment (where a nursery school can be located
in middle- or low-quality air zone).
In general, two terminal nodes №6 and №10 include 106 children;
and the average prevalence of respiratory system diseases among
them is:
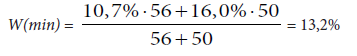
Thus, the relative risk (RR) of influence of the said above complex of RFs:
RR = W (max) / W (min) = 32, 0 / 13, 2 = 2, 4;
95% confidence interval forRR =(1,7 – 3,0)
Analysis of the terminal nodes those are not included in the decision rule:
Four terminal nodes from six obtained for Classification Tree
(Figure 1) have been included to decision rule. Two remaining nodes
№ 8 and 11 too provide important information on the influence of RFs
complex on children health. Therefore, the “way” to node№8 shows
that negative health effect of such a strong RF as physical inactivity
can be compensated by the lack of action of such RFs as “High
IAUTO” and “Gas stove in the apartment”. That is, the presence of
one RF is compensated by the lack of action of two others. On the
other hand, the way to node №11 shows that the negative impact of
two RFs “High and middle IAUTO” and “Gas stove in the apartment”
can be compensated by sufficient physical activity of a child. The latter
conclusion is particularly important because “Air pollution from
vehicles emission” and “Gas stove in apartment” are the factors that
the child’s parents are not always able to change, whereas, to provide
the child with adequate physical activity is a quite feasible task for any
family with any level of family’s well being.This example shows that the results obtained by the Classification
tree method is suitable for graphical representation, visually, and is
easy to interpret.
This is an important property of the Classification tree method,
as the results should be transferred to environmental/health controls
and medical practitioners to make decisions in the treatment and
prevention work.
Risk factors for themental and behavioral disorders (Example 2):
Consider a second example of the classification trees application
for searching the complex of RFs maximally influencing the behavioral
disorders among Ekaterinburg preschoolers. According to our data,
the prevalence of behavioral disorders is significantly higher in boys
than in girls (Table 2). For this reason the analysis was conducted
only for boys.The literature definitely indicates that the behavioral disorders
prevalence increases under the action of environmental pollution on
children [5,25-27].Our results confirm this observation. The main
factors increasing the prevalence of behavioral disorders are: air
pollution from vehicles emission and air pollution in an apartment
from products of combustion of natural gas (gas stove), as well as
contamination of drinking water that children consume at home.
The results of classification tree building are shown in Figure 2.
From the five terminal nodes (№3, 5,6,8,9) for forming a decision
rule, three nodes were used (№3,5,6). Therefore, boys consuming
clean drinking water (node №3, 66 children) and boys consuming
filtered tap water (its quality is a little worse), but attending nursery
school in high-quality air zone (node №6, 25 children) have got into
a low-prevalence disease group. For this common low-prevalence
class that includes 91 boys (66 + 25 = 91), the prevalence of behavioral disorders is
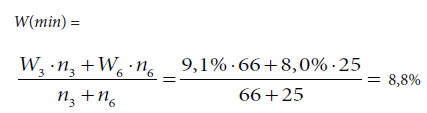
Prevalence W(min) proves to be greatly lower than the average
prevalence among all children W1=23,6 %.
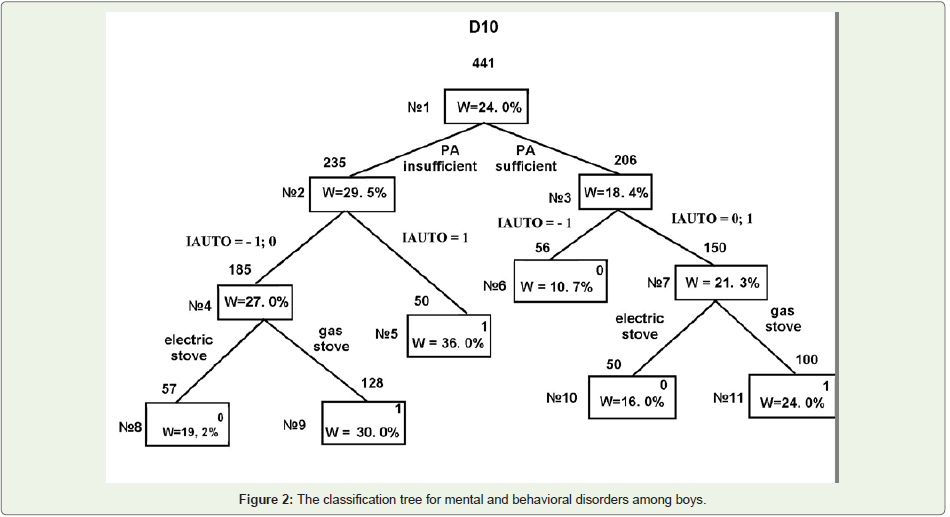
Boys consuming middle- and low-quality drinking water and
attending nursery school in zones with middle- and high- levels
of air pollution (IAUTO = 0, +1) have got into a high-prevalence
disease group. For this class that includes 124 boys, the prevalence of
behavioral disorders W(max) = W5 = 34,7% proves to be higher than
the average prevalence among all children–W1=23,6 %.
Thus, the relative risk (RR) of influence of complex of RFs
(contamination of drinking water and air pollution) is:
RR= W(max)/W(min)=34,7/8,8=3,9;
95% confidence interval for RR = (2, 7 – 5, 0).
Note that in this case, it is possible to specify those RFs,
the removing of which dramatically reduces disease prevalence
(contamination of drinking water and air pollution). At the same
time, the list of RFs, which can dramatically increase the disease
prevalence, is less certain in this situation. Nevertheless, it turns out
that the removal of only two RFs(contamination of drinking water
and air pollution) reduces disease prevalence in children by almost
four times!
Let us carry out an analysis of the terminal nodes those are
not included in the decision rule. These nodes are the result of a
combination of the presence and the absence of the RFs action. So,
the node №7 shows that consuming tap water (water of poor quality)
may well be offset by the clean air: W7 is even lower than W1. The
node №9 shows that the action of two significant RFs(poor quality
drinking water and gas stove) does not lead to a strong increase in
the disease prevalence (W9 is only slightly higher than W1), if children
attend nursery school in zones with clean air.
Discussion
Frequently, the impact of a single RF on health is investigated
in research that is being conducted in the field of environmental
epidemiology. All adjustments made for the confounding factors
allow reducing the bias, but the results still remain “single-factor”
[28,29]. Meanwhile, according to the modern paradigm of the web
of causation, we are dealing with the influence on the health of a
number of factors simultaneously [4,7-9]. In this article, the authors
propose to use one of the methods of multivariate data analysis–the
classification trees method.
Classification trees method proved to be an effective tool for
finding RFs complex (set of RFs) having the greatest impact on
population health under simultaneous action. For example (Figure 1), for respiratory system diseases in children, the most dangerous
combination of RFs turns out to be air pollution (indoor and outdoor),
combined with physical inactivity of the child. At the same time, air
pollution is a nonmodifiable RF (as outdoor) or a difficult modifiable
factor (as indoor), whereas, physical activity can be regulated by
the child’s parents. This conclusion follows from the analysis of the
terminal nodes of the classification tree (Figure 1). Decision rules of the classification tree method (rules describing groups of children
with low and high prevalence) are formed on the basis of this analysis.
In addition, different conclusions about possible changes in impacts
of some RFs in the presence/absence of other RFs can be drawn by
analysis of the nodes, which are not included in the decision rule.
Therefore, for “Behavioral disorders” the node №9 (Figure 2) shows
that the presence of two RFs “tap water” and “gas stove” is fully
compensated by the absence of RFs “Outdoor air pollution” (W9 is
only slightly higher than W1).
Note that the results obtained by the classification tree method
are suitable for graphical representation; therefore, the conclusions
made on this basis are evident and easy to interpret for scientists in
the field of medical and environmental monitoring, as well as for
practical health care professionals.
The findings of the current study about the impact of RFs on
population health are consistent with those of earlier studies [29-32].
A number of recent epidemiologic studies have found association
between air pollution and respiratory disease and some behavioral
disorders [8,26,27].
There are many large European research projects that show
that air pollution is an important environmental RF for the health
of children and adults (APHEA; Aphecom project; CESAR; Enrieco
Project: Environmental Health Risks in European Birth Cohorts;
ESCAPE идр.) Let us discuss some of them in detail.
The Aphecom project, or “Improving Knowledge and
Communication for Decision Making on Air Pollution and Health in
Europe”. Ultimately, through this study, the Aphekom project hopes
to contribute to reducing both air pollution and its impact on health
and well being across Europe.
The ESCAPE project (European Study of Cohorts for Air Pollution
Effects) investigates long-term effects of air pollution exposure on
human health in Europe. The background is that current estimates
of the European health impact of exposure to especially fine particles
in the air are large. In particular, the ESCAPE study investigates
relationships between (a) air pollution and adverse prenatal health
outcomes, and development of diseases such as asthma in children;
(b) respiratory disease endpoints in adults; (c) cardiovascular disease
endpoints in adults.
The Girona project investigates the association between long-term
exposure to traffic-related air pollution and subclinical atherosclerosis
in Spain, and modification of this association by diet and other.
The CESAR project (Central European Study on Air Pollution
and Respiratory Health) in addition to the study of the air pollution influence on the respiratory health of children, also investigates the
role of nutrition in children’s respiratory health.
Analysis of the above projects has shown that the set of factors
included in the study may be relatively narrow (only air pollution); it
may be expanded by some dietary factors (diet). Finally, the research
may include a rather wide range of RFs, among which are both social
and family RFs.
A wide range of included RFs should be assigned as advantages of
our study. Therefore, apart from the effect of atmospheric pollution
(outdoor air), we examine necessarily the influence of such RFs as
the presence of a gas stove in an apartment (a marker of internal
contamination, indoor air), as well as such factors as maternal
education, psychological climate in the family, and so on.
In this regard, the authors noted that our results are consistent
with the results of earlier studies that have found the impact of social
and family RFs on health [5,10].
In contrast to the results listed above, the classification tree
method allows one to analyze the combined influence of RFs of a
different nature on human health.
As already noted, analyzing the joint effects of RFs, it is possible
to investigate reducing the negative impact of some RFs by modifying
other RFs. To implement this possibility, some of the RFs should be
modifiable (factors can be changed). In most cases, the modifiable
factors are family factors, behavioral, and other factors not related
to the environment pollution. It follows that studying the influence
of such factors (not only environmental pollution) on public health
allows us to describe a web of causation for non communicable
diseases.
Conclusions
In summary, such factors as atmospheric pollution, gas-stove
in apartment, parent smoking, low-quality drinking water, child’s
insufficient physical activity, and mother’s low educational attainment
increase the prevalence of diseases even in terms of univariate
approach. The authors have identified RFs sets having a maximum
negative influence on the prevalence of respiratory diseases and
behavior disorders in children. Therefore, a combination of physical
inactivity along with attending a nursery school in poor-quality air
zone or with gas stove in an apartment increases the prevalence of
respiratory diseases in 2.4 times. Further, a combination of poorquality
air (indoor and outdoor) along with consuming poor-quality
drinking water increases the prevalence of mental and behavioral
disorders among boys of preschool age in Ekaterinburg in 3.9 times.
References
23. The State report on the state of environment in the Sverdlovsk region in 2009
[electronic resource.
Citation
Konstantinova E, Varaksin A. Impact of Multivariate Risk Factors on Children’s Health in Ekaterinburg: A Cross-Sectional Study. J Environ Soc Sci. 2015;2(1): 107.