


Research Article
Livelihood Diversification, Financial Inclusion and Food and Nutrition-Related Indicators among Pahariya Households in Two PVTG Dominated Blocks of Jharkhand, India: Evidence from a Cross-Sectional Baseline Survey
Debanjan Chakraborty*
MBA, MSW, MA (English); Regional Head, Jharkhand, Sarva Seva Samity Sanstha (4S India), Jharkhand, India.
*Corresponding author:Debanjan Chakraborty, Central Coordination Office: B 247, Salt Lake Sector II, West Bengal, India. E-mail Id: chakraborty.debanjan83@gmail.com
Article Information:Submission: 03/09/2026; Accepted: 06/10/2026; Published: 10/10/2026
Copyright: © 2026 Chakraborty D, et al. This is an open access article distributed under the Creative Commons Attribution License, which permits unrestricted use, distribution, and reproduction in any medium, provided the original work is properly cited.
Abstract
Particularly Vulnerable Tribal Groups (PVTGs) in India experience interconnected livelihood, food-access and social-service vulnerabilities. However, household-level evidence linking livelihood resources, financial inclusion, productive assets and food-related practices within PVTG communities remains limited. This study examined these associations among Pahariya households in two PVTG-dominated blocks of Jharkhand.
Methods: A community-based cross-sectional baseline census was conducted under the PAHCHAN (Participatory Action for Holistic Community Advancement and Nutrition) project in Littipara Block of Pakur district and Sundarpahari Block of Godda district. The analysis included 993 households (591 Littipara; 402 Sundarpahari). Household socio-demographic characteristics, livelihood sources, annual income, savings, land, livestock, Self-Help Group (SHG) participation, bank-account ownership, nutrition-garden maintenance, meal frequency and an exploratory dietary-diversity score were analysed. Skewed continuous variables were summarized using medians and interquartile ranges; block comparisons used Mann–Whitney U or Pearson’s chi-square tests as appropriate. Exploratory binary logistic regression examined nutrition-garden maintenance and lower meal frequency (≤2 meals/day).
Results: Median annual household income was ₹14,200 (IQR ₹7,250–48,250) in Littipara and ₹21,000 (IQR ₹16,400–28,400) in Sundarpahari. Littipara households had more earning members, cultivable land and livestock, higher savings, nutrition-garden maintenance (26.9% vs 8.0%) and adult literacy (41.5% vs 28.1%). Bank-account ownership was 95.3% in both blocks and SHG participation was similar (71.2% vs 72.6%). Reported meal-frequency patterns differed markedly: 72.8% of Littipara households reported three meals per day, compared with 8.2% in Sundarpahari. In adjusted models, nutritiongarden maintenance was positively associated with SHG membership, current savings, livestock ownership and adult literacy, whereas lower meal frequency was strongly associated with Sundarpahari residence and was inversely associated with household income and adult literacy.
Conclusion: The findings indicate substantial contextual heterogeneity among Pahariya households and show that income alone does not adequately capture household livelihood and food-related conditions. Integrated, context-specific approaches combining productive assets, savings and financial capability, community institutions, nutrition gardens, livestock, agricultural support and human-capital development may be more appropriate than singlesector interventions. Because the study is cross-sectional and several measures are self-reported or exploratory, the associations should not be interpreted causally.
Keywords:Pahariya; Particularly Vulnerable Tribal Groups; Livelihoods; Financial Inclusion; Self-Help Groups; Food-Related Indicators.
Introduction
Food and nutrition security is shaped not only by the availability
of staple foods but also by household purchasing power, livelihood
stability, dietary quality, access to services, human capital and the
resilience of local food systems. Contemporary nutrition-sensitive
approaches therefore emphasise the interaction of agriculture,
livelihoods, financial resources, women’s collective action, health,
education and the wider food environment (Ruel & Alderman, 2013;
Kadiyala et al., 2014; Ruel et al., 2018; FAO et al., 2024) [1-4]. This
perspective is particularly relevant for indigenous and geographically
marginalised populations whose livelihoods depend on rainfed
agriculture, forests, livestock and seasonal labour and are therefore
sensitive to climatic and market shocks.
India has 75 notified Particularly Vulnerable Tribal Groups (PVTGs), characterized by extreme socio-economic and geographical vulnerability and, historically, by subsistence-oriented economies, very low literacy and limited access to services (Ministry of Tribal Affairs, 2018) [5]. National surveys provide important evidence on Scheduled Tribes but generally do not permit detailed interpretation of livelihood and food-system differences within individual PVTGs. The Pahariya communities of the Rajmahal Hill region of Jharkhand are therefore an important population for household-level research.
India has 75 notified Particularly Vulnerable Tribal Groups (PVTGs), characterized by extreme socio-economic and geographical vulnerability and, historically, by subsistence-oriented economies, very low literacy and limited access to services (Ministry of Tribal Affairs, 2018) [5]. National surveys provide important evidence on Scheduled Tribes but generally do not permit detailed interpretation of livelihood and food-system differences within individual PVTGs. The Pahariya communities of the Rajmahal Hill region of Jharkhand are therefore an important population for household-level research.
Existing research from Jharkhand demonstrates that Pahariya
food systems are closely linked to agroforestry, indigenous foods and
ecological conditions. Studies among Sauria Paharia communities
have documented limited dietary diversity, poor nutrient intake, the
nutritional contribution of indigenous foods, and pathways through
which climate variability affects agroforestry and food consumption
(Ghosh-Jerath et al., 2020a; Ghosh-Jerath et al., 2021a; Ghosh-
Jerath et al., 2021b) [6-8]. These studies establish the importance of
food-system and ecological pathways, but they do not directly address
how household livelihood portfolios, financial inclusion, savings,
livestock and community institutions coexist with household-level
food-access indicators across different Pahariya programme settings.
The sustainable livelihoods perspective provides a useful
framework for interpreting these relationships. Chambers and
Conway (1992) [9] and Ellis (2000) [10] emphasised that rural
livelihoods combine capabilities and assets with diverse activities
and strategies. Livelihood diversification may reduce dependence on
a single income source, while livestock and other productive assets
can act as both income-generating resources and buffers against
shocks (Barrett et al., 2001) [11]. Financial inclusion may also support
consumption smoothing and investment in productive activities,
although account ownership alone does not necessarily indicate
effective financial capacity (Demirgüç-Kunt et al., 2022) [12].
The present study uses baseline data from the PAHCHAN project
to examine associations among livelihood characteristics, financial
inclusion, productive assets and household food-related indicators
in two PVTG-dominated blocks. The study deliberately avoids
causal claims because the data are cross-sectional and do not include
anthropometric measurements or fully validated dietary assessment
instruments. The principal research question was: which livelihood,
financial and productive-asset characteristics are associated with
household food-related indicators among Pahariya households in
Littipara and Sundarpahari?
Although existing studies have documented important relationships between agroforestry, indigenous foods and dietary outcomes among Pahariya communities, less is known about how household livelihood resources, productive assets, financial participation and household food practices coexist within different Pahariya programme settings. In particular, comparisons across PVTG-dominated locations may reveal contextual differences that are not apparent from household income or single-sector indicators alone. Understanding these relationships is relevant for designing integrated livelihood and nutrition interventions for geographically marginalised communities.
Specific objectives were to: (i) describe the socio-economic and livelihood profile of surveyed households; (ii) compare income, savings, land and livestock between the two blocks; (iii) assess bankaccount ownership and SHG participation; (iv) compare nutritiongarden maintenance and household meal frequency; (v) examine bivariate associations between selected livelihood characteristics and food-related indicators; (vi) assess correlations between household income and selected productive assets; and (vii) explore adjusted associations with nutrition-garden maintenance and lower meal frequency using binary logistic regression.
Materials and Methods
Study design and setting:
A community-based cross-sectional household survey was
conducted between January’ 26 and March’ 26 using baseline data
collected under the PAHCHAN (Participatory Action for Holistic
Community Advancement and Nutrition) project. The survey was
undertaken before implementation of project interventions and
was designed to characterize household socio-economic conditions,
livelihood systems and selected food-related indicators.The study covered Littipara Block of Pakur district and Sundarpahari Block of Godda district, Jharkhand, eastern India. The two areas are situated within the Rajmahal Hill region and include Pahariya settlements characterized by undulating terrain, predominantly rainfed cultivation, fragmented landholdings, dependence on forests and non-timber forest products, seasonal wage labour and limited irrigation and market connectivity. These conditions make the area relevant for examining the interaction between livelihood resources and household food access.
Study population and Census Approach:
The unit of analysis was the household. Respondents were
household heads or other adult members knowledgeable about
household livelihood activities, income, assets and food practices. A
census approach was adopted within the PAHCHAN intervention
villages rather than a probability sample. All households in the
intervention villages were approached for participation, and no
household refused to provide information. A total of 993 completed
household records were available for analysis: 591 in Littipara and 402
in Sundarpahari. Thus, no sample-size calculation was undertaken.
The census approach reduces sampling error within the programme
area but does not make the results representative of all Pahariya
households or other PVTGs.Data collection and variables:
A structured baseline questionnaire covered demographic
characteristics, education and occupation, agricultural practices,
annual household income, livelihood sources, livestock ownership,
landholding, SHG participation, savings and financial services,
nutrition-garden maintenance, government-programme coverage
and household meal frequency. The questionnaire was prepared in
English and translated into Hindi for field implementation. Trained
field investigators conducted face-to-face interviews under project team
supervision.The primary household-level outcomes were (i) nutrition-garden maintenance and (ii) reported meal frequency. These were treated as proxy indicators relevant to food access and nutrition-sensitive livelihood practices rather than direct measures of nutritional status. Explanatory variables included household income, livelihood characteristics, livestock ownership, land access, SHG membership, bank-account ownership, current savings, adult literacy and block of residence.
An exploratory Livelihood Diversification Score (LDS) was
calculated as the number of distinct livelihood categories reported
across primary and secondary occupation variables. An exploratory
Dietary Diversity Score (DDS) was calculated as the number of
distinct food groups represented in the household’s reported
weekly food-consumption response. These constructs were derived
from the available questionnaire and were not treated as validated
scales. The distinction is important because validated household
dietary-diversity instruments require defined food groups and recall
procedures (Swindale & Bilinsky, 2006) [13]. The household-level
DDS also does not provide information on individual dietary intake
or intra-household allocation of foods.
Reported child malnourishment was retained as a descriptive,
household-reported indicator among households for which
the question was applicable. It was not treated as a measured
anthropometric outcome.
Data management and statistical analysis:
Completed questionnaires were reviewed for completeness
before data entry. The analytical dataset was screened for missing
observations, inconsistent responses, duplicate records, variable
coding and extreme observations. No observations were altered
or excluded solely because of statistical extremeness. Continuous
variables exhibiting substantial skewness were summarized using
medians and Interquartile Ranges (IQR), and non-parametric
methods were used for between-block comparisons where
appropriate.The final analytical dataset comprised 993 households. Missing
or ‘not applicable’ responses were excluded from individual analyses
where relevant. The variables included in the two multivariable
logistic regression models had complete observations for all 993
households; consequently, no observations were lost because of
missing predictor or outcome data in these models. Approximately
normally distributed continuous variables were summarized using
means and standard deviations, whereas skewed variables were
summarized using medians and IQRs. Between-block comparisons used independent-samples
t-tests for approximately normal variables and Mann–Whitney U
tests for skewed variables. Categorical variables were compared using
Pearson’s chi-square test, with Fisher’s exact test where expected
frequencies were small. All tests were two-sided and a nominal
p-value of <0.05 was considered statistically significant.
Spearman’s rank correlation coefficient was used to assess
associations between reported annual household income and selected
livelihood and productive-asset variables. Bivariate associations
between categorical livelihood/financial variables and food-related
indicators were assessed using Pearson’s chi-square tests. Because
multiple exploratory comparisons were undertaken, p-values were
interpreted as nominal evidence, with emphasis also placed on the
magnitude and consistency of observed associations.
For regression, meal frequency was dichotomized as ≤2 versus >2 meals/day. Two exploratory binary logistic regression models were fitted to examine adjusted associations with (i) nutrition-garden maintenance and (ii) lower household meal frequency. Predictors were selected a priori to represent contextual, livelihood, financial, productive-asset and human-capital domains and included study block, household income, LDS, SHG membership, bank-account ownership, current savings, livestock ownership and adult literacy. Household income and current savings were natural-log transformed using ln(x+1) to accommodate right-skewed distributions while retaining households with zero values. Adjusted Odds Ratios (AORs) with 95% confidence intervals (CIs) were reported. Both models were fitted using the complete set of 993 households. Model convergence was assessed, multicollinearity was examined using variance inflation factors, model discrimination was assessed using the area under the receiver operating characteristic curve (AUC), and goodness-offit was examined using the Hosmer–Lemeshow test (Hosmer et al., 2013). The regression analyses were exploratory and were interpreted as adjusted associations rather than causal relationships.
For regression, meal frequency was dichotomized as ≤2 versus >2 meals/day. Two exploratory binary logistic regression models were fitted to examine adjusted associations with (i) nutrition-garden maintenance and (ii) lower household meal frequency. Predictors were selected a priori to represent contextual, livelihood, financial, productive-asset and human-capital domains and included study block, household income, LDS, SHG membership, bank-account ownership, current savings, livestock ownership and adult literacy. Household income and current savings were natural-log transformed using ln(x+1) to accommodate right-skewed distributions while retaining households with zero values. Adjusted Odds Ratios (AORs) with 95% confidence intervals (CIs) were reported. Both models were fitted using the complete set of 993 households. Model convergence was assessed, multicollinearity was examined using variance inflation factors, model discrimination was assessed using the area under the receiver operating characteristic curve (AUC), and goodness-offit was examined using the Hosmer–Lemeshow test (Hosmer et al., 2013). The regression analyses were exploratory and were interpreted as adjusted associations rather than causal relationships.
Ethical considerations and limitations:
Participation was voluntary. Before data collection, the
purpose and process were explained to the Gram Sabha, Pradhan/
traditional leaders, community elders, Changemakers, volunteers
and community members. Respondents were informed about the
information to be collected and their right to decline. Verbal consent
was obtained before interviews; no formal written informed-consent
procedure was undertaken. Personal identifiers were removed during
analysis.Results
Household profile and socio-demographic characteristics:
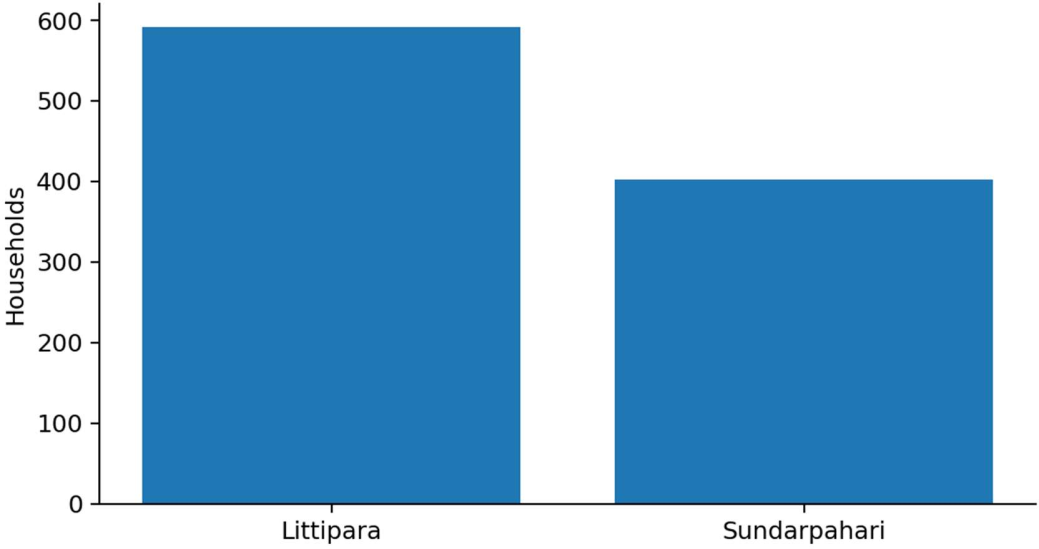
Figure 1 presents the distribution of the 993 surveyed households
across the two study blocks. Littipara contributed 591 households
(59.5%), while Sundarpahari contributed 402 households (40.5%).
This distribution reflects the census of eligible households within the
respective study areas rather than probability-based sampling. Thus,
the difference in the number of surveyed households should not be
interpreted as a difference in population characteristics by itself.The household profile showed a marked structural contrast between the two blocks. Male-headed households predominated in both settings, while housing conditions differed sharply. Kutcha housing was reported by 95.3% of households in Sundarpahari compared with 46.9% in Littipara, whereas pucca housing was substantially more common in Littipara. Firewood dependence was nearly universal in both settings. Agriculture was the dominant main occupation in both blocks, but was more prevalent in Littipara, whereas wage labour was more common in Sundarpahari. These differences suggest that the two intervention settings cannot be treated as socio-economically interchangeable despite their shared Pahariya context.
(Figure 1) primarily establishes the composition of the study
population and provides the denominator for subsequent blockwise
comparisons. The larger contribution from Littipara reflects
the number of eligible households surveyed and should not be
interpreted as evidence of greater household vulnerability or
better socio-economic conditions in that block. [Table 1] further
demonstrates that the two blocks shared some characteristics but
differed considerably in their physical living environment.
Male-headed households accounted for 74.6% of households
Male-headed households accounted for 74.6% of households
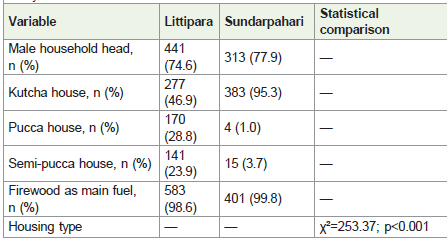
in Littipara and 77.9% in Sundarpahari, indicating broadly similar
household-head profiles. In contrast, housing conditions showed a
pronounced block-level difference. Kutcha housing was reported
by nearly all households in Sundarpahari (95.3%), compared with
46.9% in Littipara. Conversely, pucca housing was reported by 28.8%
of Littipara households but only 1.0% of Sundarpahari households,
while semi-pucca housing accounted for 23.9% and 3.7%, respectively.
The association between housing type and study block was highly
significant (χ²=253.37, p<0.001), indicating substantial structural
differences in the physical housing environment.
Firewood was the principal household fuel for almost all households in both Littipara (98.6%) and Sundarpahari (99.8%). Thus, although housing conditions differed substantially, dependence on traditional household fuel was a common feature across both settings rather than a distinguishing characteristic.
Taken together, [Figure 1] and [Table 1] establish that the study population had a shared Pahariya context but considerable heterogeneity in household living conditions. This contextual difference is important when interpreting subsequent livelihood, financial and food-related indicators.
Livelihood and economic characteristics:
[Table 2] presents selected continuous livelihood and economic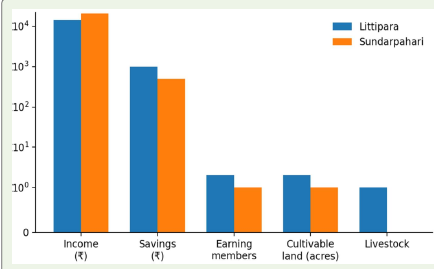
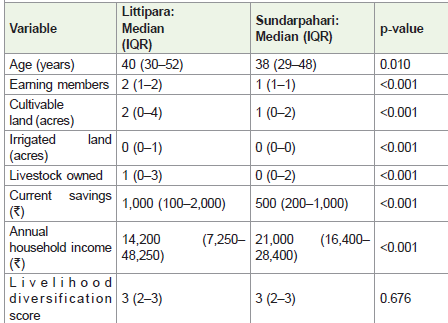
indicators. Clear differences were observed in productive assets and
household economic characteristics.
Littipara households had a higher median number of earning members than Sundarpahari households (2 [IQR 1–2] versus 1 [IQR 1–1]; p<0.001). Median cultivable land was 2 acres (IQR 0–4) in Littipara compared with 1 acre (IQR 0–2) in Sundarpahari (p<0.001), and median livestock ownership was 1 animal (IQR 0–3) versus 0 (IQR 0–2; p<0.001).
The median amount of irrigated land was zero in both blocks. Although the distributions differed statistically (p<0.001), the identical medians indicate that irrigation access was limited in both settings and that the statistical difference should not be interpreted as a large difference in typical irrigation availability.
Annual household income showed the opposite pattern: the median was 14,200 (IQR 7,250–48,250) in Littipara and 21,000 (IQR 16,400–28,400) in Sundarpahari (p<0.001). Thus, higher reported annual income in Sundarpahari coexisted with fewer earning members and lower median land, livestock and savings. The exploratory LDS had the same median in both blocks (3 categories; IQR 2–3; p=0.676), despite differences in the composition and level of productive resources.
[Figure 2] provides a visual comparison of the central values reported in [Table 2]. It highlights the relatively stronger productive asset position of Littipara households, particularly in terms of earning members, cultivable land and livestock ownership. The figure also shows higher median savings in Littipara. However, the income pattern is different: despite having fewer earning members and lower median productive-asset indicators, Sundarpahari households reported higher median annual household income. Because the vertical axis is logarithmic and the indicators are measured in different units, the figure should be interpreted primarily in terms of the relative block-wise values rather than the visual distances between bars.
Importantly, annual household income was higher in
Sundarpahari despite its lower median productive-asset base. Median
annual income was 21,000 in Sundarpahari compared with
14,200 in Littipara (p<0.001). This divergence indicates that current reported income and the longer-term structure of productive assets represent different dimensions of household economic position. Income may reflect wage labour, seasonal employment or other cash-generating activities that are not captured by land and livestock ownership alone.
The exploratory livelihood diversification score (LDS) had the same median in both blocks: 3 categories (IQR 2–3; p=0.676). Thus, the number of livelihood categories was broadly similar, even though the composition, productive assets and likely economic returns associated with those livelihoods differed. The LDS therefore captures the number of livelihood categories but does not fully describe their intensity, profitability, seasonality or stability.
Financial inclusion and savings:
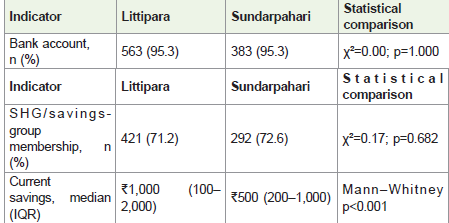
Formal financial access was high and almost identical across
the two blocks. Bank-account ownership was reported by 95.3% of
households in both Littipara and Sundarpahari (p=1.000). SHG/
savings-group membership was similarly prevalent, at 71.2% and
72.6%, respectively (p=0.682).In contrast, current savings differed significantly between the blocks. The median savings balance was 1,000 in Littipara compared with 500 in Sundarpahari (p<0.001). Thus, the findings distinguish access to financial institutions from actual financial liquidity. Although almost all households had bank accounts and approximately seven in ten belonged to SHG/savings groups, the amount of immediately available savings was substantially lower in Sundarpahari.
This suggests that account ownership and group membership
alone may not adequately capture effective financial capacity. The
difference in savings balances may be more informative when
considering households’ ability to absorb shocks, purchase food or
invest in productive activities.
Household meal frequency and dietary diversity:
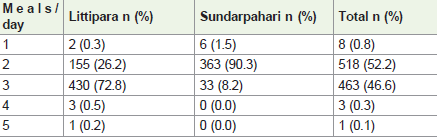
Meal frequency showed the strongest descriptive contrast
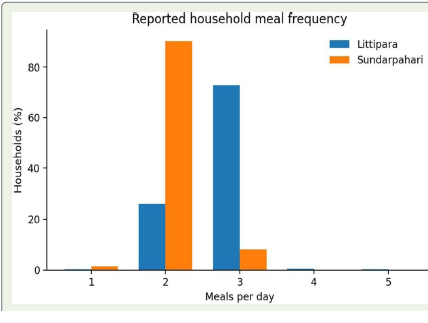
between the two blocks.Meal frequency showed the strongest descriptive contrast. In Littipara, 72.8% of households reported three meals per day and 26.2% reported two. In Sundarpahari, 90.3% reported two meals and only 8.2% reported three. The overall distribution differed strongly (χ²=408.76, p<0.001). Because meal frequency is a household reported food-access/consumption indicator rather than a validated food-security scale, the finding should be interpreted as a difference in reported meal patterns, not as a direct prevalence estimate of food insecurity.
The exploratory DDS, based on the six food groups explicitly
represented in the questionnaire, ranged from 1 to 6. The median was 4
in both blocks (IQR 3–5 in Littipara and 3.25–5 in Sundarpahari), but
the distributions differed significantly (Mann–Whitney U=103,814;
p<0.001). Mean DDS was 4.03 in Littipara and 4.30 in Sundarpahari.
The identical medians alongside a significant distributional test
illustrate why statistical significance should not be equated with a
large difference in central tendency. [Figure 3] makes the marked
divergence in reported meal patterns particularly evident. The Littipara
distribution is concentrated overwhelmingly around three meals per
day, whereas the Sundarpahari distribution is concentrated around
two meals per day. Thus, the figure demonstrates not merely a small
difference in average meal frequency but a substantial redistribution
of households between the two principal meal-frequency categories.
The overall distribution differed strongly between the blocks (χ²=408.76, p<0.001). This represents a substantial descriptive difference in reported household meal patterns. However, meal frequency is a household-reported food-access/consumption indicator and is not equivalent to a validated food-security scale. The finding should therefore be interpreted as a difference in reported meal patterns rather than as a direct prevalence estimate of household food insecurity.
The overall distribution differed strongly between the blocks (χ²=408.76, p<0.001). This represents a substantial descriptive difference in reported household meal patterns. However, meal frequency is a household-reported food-access/consumption indicator and is not equivalent to a validated food-security scale. The finding should therefore be interpreted as a difference in reported meal patterns rather than as a direct prevalence estimate of household food insecurity.
The exploratory dietary diversity score (DDS), based on the six
food groups explicitly represented in the questionnaire, ranged from
1 to 6. The median DDS was 4 in both blocks, with IQRs of 3–5 in
Littipara and 3.25–5 in Sundarpahari. Despite the identical medians,
the distributions differed significantly (Mann–Whitney U=103,814;
p<0.001). Mean DDS was 4.03 in Littipara and 4.30 in Sundarpahari.
The combination of identical medians but a statistically significant
distributional test is important. It indicates that the difference was
not necessarily a shift in the typical household from one DDS level to
another; rather, the distributions contained different patterns around
the median. Thus, statistical significance should not be interpreted as
evidence of a large difference in central dietary diversity.
Nutrition gardens, adult literacy and reported child nutrition indicator:
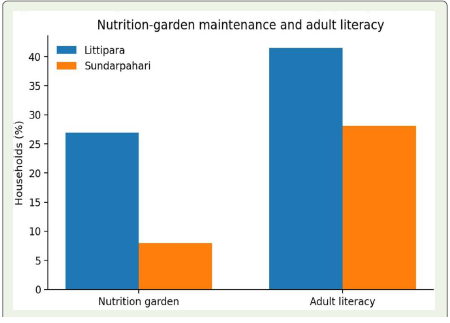
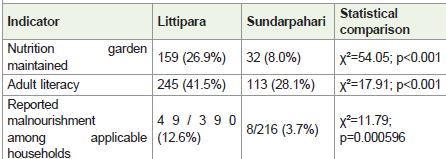
Nutrition-garden maintenance was reported by 26.9% of Littipara
households compared with only 8.0% of Sundarpahari households,
representing a difference of 18.9 percentage points. Adult literacy
was also higher in Littipara, at 41.5% compared with 28.1% in
Sundarpahari.Bivariate Associations:
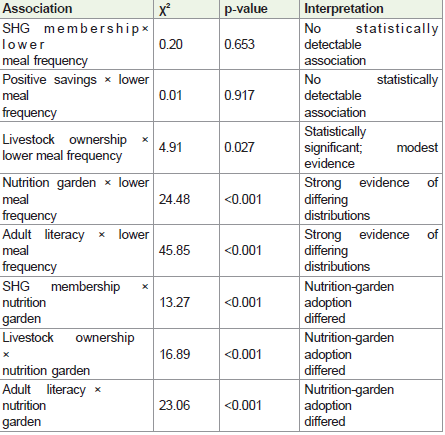
At the bivariate level, lower meal frequency was not statistically
associated with SHG membership (p=0.653) or positive savings status
(p=0.917). In contrast, associations were observed with livestock
ownership (p=0.027), nutrition-garden maintenance (p<0.001) and
adult literacy (p<0.001).Nutrition-garden maintenance was also significantly associated with SHG membership, livestock ownership and adult literacy (all p<0.001). These findings indicate that the characteristics tend to cooccur within households, but because the data are cross-sectional, they do not establish temporal ordering or causality.
Dietary diversity across household characteristics:
The relationship between DDS and selected household
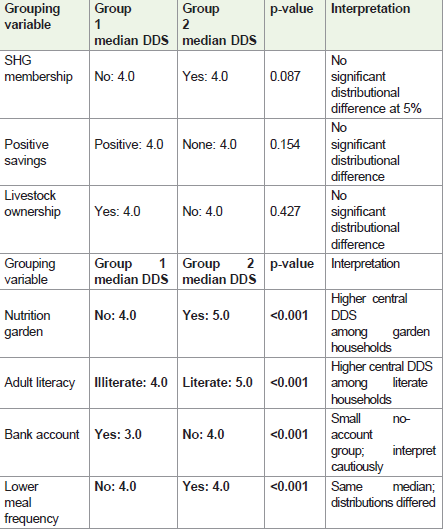
characteristics was examined further.The DDS analysis further illustrates the distinction between statistical significance and substantive magnitude. Nutrition-garden maintenance and adult literacy were each associated with a onepoint difference in median DDS, with garden households and literate households having a median DDS of 5 compared with 4 in their respective comparison groups.
By contrast, SHG membership, positive savings and livestock ownership showed no statistically significant distributional difference in DDS at the 5% level, despite their associations with other household characteristics.
For lower meal frequency, the median DDS remained 4 in both groups even though the distributional test was significant (p<0.001).
Therefore, the result indicates differences in the overall DDS
distributions rather than a difference in median dietary diversity.
The bank-account result should be interpreted cautiously because the number of households without a bank account was relatively small. The apparently higher median DDS among this small subgroup does not provide evidence that lack of a bank account improves dietary diversity.
The bank-account result should be interpreted cautiously because the number of households without a bank account was relatively small. The apparently higher median DDS among this small subgroup does not provide evidence that lack of a bank account improves dietary diversity.
Correlations between household income and livelihood assets:
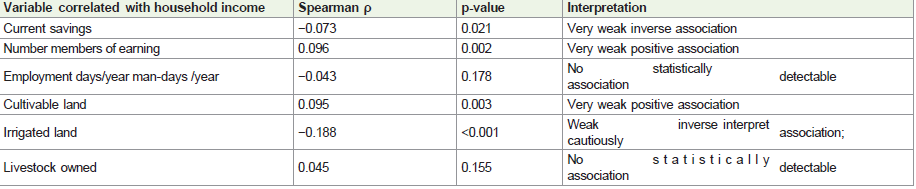
Income was very weakly positively correlated with the number of
earning members (ρ=0.096, p=0.002) and cultivable land (ρ=0.095,
p=0.003). It was very weakly inversely correlated with current savings
(ρ=−0.073, p=0.021) and weakly inversely correlated with irrigated
land (ρ=−0.188, p<0.001).The inverse association with irrigated land was the strongest correlation in magnitude but remained weak. It should not be interpreted as evidence that irrigation reduces household income. Employment man-days (ρ=−0.043, p=0.178) and livestock ownership (ρ=0.045, p=0.155) were not significantly correlated with income.
Overall, the small correlation coefficients indicate that individual livelihood assets explained only a limited proportion of variation in reported household income. The results also illustrate that, in a sample of 993 households, statistical significance should not be equated with strong substantive association.
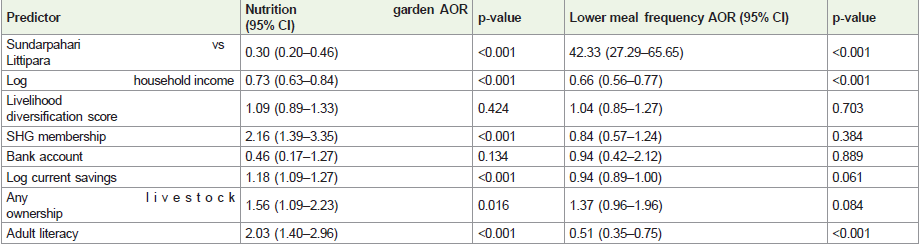
Exploratory Multivariable Analysis:
After adjustment for the variables included in the model,
Sundarpahari households had substantially lower odds of reporting
a nutrition garden than Littipara households (AOR=0.30, 95% CI
0.20–0.46; p<0.001). SHG membership (AOR=2.16), higher current
savings (AOR=1.18), livestock ownership (AOR=1.56) and adult
literacy (AOR=2.03) were positively associated with nutrition-garden
maintenance. LDS and bank-account ownership were not statistically
significant.The inverse association between log household income and nutrition-garden maintenance (AOR=0.73, 95% CI 0.63–0.84; p<0.001) was counterintuitive. It may reflect differences in livelihood composition, market dependence or other unmeasured household characteristics. Because income and garden status were measured at the same time, the direction of association cannot be established; the finding should therefore be regarded as hypothesis-generating rather than as evidence that higher income discourages garden maintenance.
For lower meal frequency, defined as ≤2 meals/day, the block-level
association was very large. Sundarpahari households had 42.33 times
the adjusted odds of reporting ≤2 meals/day compared with Littipara
households (95% CI 27.29–65.65; p<0.001). Higher household
Income was very weakly positively correlated with the number of earning members (ρ=0.096, p=0.002) and cultivable land (ρ=0.095, p=0.003). It was very weakly inversely correlated with current savings (ρ=−0.073, p=0.021) and weakly inversely correlated with irrigated land (ρ=−0.188, p<0.001).
The inverse association with irrigated land was the strongest
correlation in magnitude but remained weak. It should not be
interpreted as evidence that irrigation reduces household income.
Employment man-days (ρ=−0.043, p=0.178) and livestock ownership
(ρ=0.045, p=0.155) were not significantly correlated with income.
Overall, the small correlation coefficients indicate that individual livelihood assets explained only a limited proportion of variation in reported household income. The results also illustrate that, in a sample of 993 households, statistical significance should not be equated with strong substantive association. income was associated with lower odds of the outcome (AOR=0.66, 95% CI 0.56–0.77), and adult literacy was also associated with lower odds (AOR=0.51, 95% CI 0.35–0.75). LDS, SHG membership, bank-account ownership, current savings and livestock ownership were not statistically significant at the 5% level.
The very large block coefficient should be interpreted as evidence of strong contextual separation in the observed meal-frequency patterns rather than as evidence that residence in Sundarpahari itself causes lower meal frequency.
Both logistic regression models converged successfully and used all 993 households. The nutrition-garden model included 191 outcome events and showed moderate discrimination (AUC=0.766); the lower-meal-frequency model included 526 outcome events and showed strong discrimination (AUC=0.875).
Multicollinearity was not problematic, with all variance inflation factors below 1.21. Goodness-of-fit was acceptable for the lowermeal- frequency model (Hosmer–Lemeshow p=0.638), whereas the nutrition-garden model showed evidence of imperfect calibration (Hosmer–Lemeshow p=0.002). Accordingly, both models were interpreted as exploratory association models rather than predictive models.
Discussion
Contextual heterogeneity in Pahariya household livelihoods:
The present study demonstrates substantial heterogeneity in the
socio-economic and livelihood conditions of Pahariya households
across Littipara and Sundarpahari, despite their shared Pahariya
and PVTG context. Differences were evident not only in household
economic resources but also in housing conditions, productive assets,
savings, nutrition-garden maintenance, adult literacy and reported
meal patterns. This is consistent with the broader understanding of
rural livelihoods as multidimensional systems in which households
combine natural, physical, human, financial and social resources to
secure their living (Chambers & Conway, 1992; Ellis, 2000; Scoones,
1998) [9,10,14]. PVTG households living within a broadly similar
geographical and cultural setting should therefore not be assumed to
experience identical forms or degrees of livelihood vulnerability.The marked difference in housing conditions provides an
important contextual dimension. Kutcha housing was reported by
almost all households in Sundarpahari, compared with less than half
in Littipara, while pucca and semi-pucca housing were considerably
more common in Littipara. At the same time, dependence on firewood
was almost universal in both blocks. This combination suggests that
some dimensions of deprivation are shared, whereas others vary
substantially by location. Housing quality may reflect accumulated
differences in household assets, infrastructure, economic opportunity
and access to public services, although the cross-sectional design does
not permit their determinants to be established.
The livelihood findings further indicate that the two populations
differed in productive-resource structure. Littipara households had
more earning members, greater median cultivable land and greater
livestock ownership. Such resources can contribute to both income
generation and direct household food availability. Agriculture–
nutrition pathways literature similarly recognises that agricultural
production can influence nutrition through food availability, income,
household decision-making and access to diverse foods (Kadiyala et
al., 2014; Ruel et al., 2018) [2,3]. However, the present findings also
demonstrate that ownership of productive assets does not necessarily
translate directly into higher reported cash income.
An important finding was the divergence between reported annual household income and the productive-asset profile. Sundarpahari households reported higher median income despite fewer earning members and lower median cultivable land, livestock ownership and savings. This apparent paradox suggests that current cash income and accumulated livelihood assets capture different dimensions of household economic position. In rural settings, reported income may reflect wage labour, seasonal employment or other cashgenerating activities that are not represented adequately by land and livestock ownership alone. Conversely, land and livestock may provide subsistence benefits, food access and resilience that are not fully captured by annual monetary income. Rural livelihood research emphasises that households commonly combine farm and non-farm activities and that the composition and stability of income may be as important as its absolute level (Barrett et al., 2001; Ellis, 2000) [11,10].
An important finding was the divergence between reported annual household income and the productive-asset profile. Sundarpahari households reported higher median income despite fewer earning members and lower median cultivable land, livestock ownership and savings. This apparent paradox suggests that current cash income and accumulated livelihood assets capture different dimensions of household economic position. In rural settings, reported income may reflect wage labour, seasonal employment or other cashgenerating activities that are not represented adequately by land and livestock ownership alone. Conversely, land and livestock may provide subsistence benefits, food access and resilience that are not fully captured by annual monetary income. Rural livelihood research emphasises that households commonly combine farm and non-farm activities and that the composition and stability of income may be as important as its absolute level (Barrett et al., 2001; Ellis, 2000) [11,10].
The lack of a significant difference in the exploratory LDS is
particularly relevant. Both blocks had a median diversification score
of three categories, even though the composition of livelihoods and
productive assets differed considerably. Simply counting livelihood
categories may therefore be insufficient to capture their economic
significance. Households with the same score may differ in the
proportion of income derived from each activity, seasonality, labour
requirements, productivity and exposure to shocks. Future research
should examine livelihood diversification using income shares,
seasonal stability, productive returns, food contribution and exposure
to shocks rather than activity count alone.
Financial inclusion and the distinction between access and financial capacity:
The financial-inclusion findings provide an additional illustration
of the difference between formal access and effective household
economic capacity. Bank-account ownership was reported by 95.3%
of households in both blocks, while approximately seven in ten
reported SHG or savings-group membership. These levels indicate
substantial penetration of formal and community-based financial
institutions in the surveyed population.However, the similarity in access contrasted with a significant difference in current savings. Littipara households reported a median savings balance twice that of Sundarpahari households. This distinction is important because financial inclusion is not limited to account ownership; its potential contribution to resilience also depends on the ability to save, access appropriate financial services, manage liquidity and use financial resources productively (Demirgüç- Kunt et al., 2022) [12]. Account ownership alone may therefore overstate effective financial capacity..
The association between SHG membership and nutrition-garden maintenance in the adjusted analysis provides further support for considering financial and social institutions together. SHGs may provide platforms for savings, collective action, information exchange and access to livelihood opportunities. In the present study, however, SHG membership was not associated with lower meal frequency after adjustment.
This distinction is important: participation in a community financial institution may be related to particular productive practices without necessarily translating directly into reported meal frequency. The findings therefore support an integrated rather than linear interpretation of pathways linking financial inclusion with household food conditions.
Meal frequency and dietary diversity represent different dimensions of household food conditions:
The strongest descriptive difference between the two blocks
concerned reported household meal frequency. Nearly three-quarters
of Littipara households reported three meals per day, whereas
90.3% of Sundarpahari households reported two meals per day. The
magnitude and consistency of this difference were also reflected in the
multivariable model, in which Sundarpahari residence was strongly
associated with reporting two or fewer meals per day.Meal frequency provides a relatively direct household-reported indication of food-consumption patterns, but it should not be equated with a comprehensive measure of food security. Food and nutrition security encompasses availability, access, utilisation and stability, and dietary adequacy cannot be inferred from the number of meals alone. The present study therefore interprets meal frequency as a household food-related indicator rather than as a validated measure of food insecurity.
The particularly striking aspect of the meal-frequency finding is its coexistence with higher median annual income in Sundarpahari. If income alone were sufficient to explain household food conditions, higher median income might be expected to coincide with more frequent meals. The observed pattern suggests that other factors may influence household food access, including the nature and stability of income, household composition, dependence on purchased food, productive assets, savings, seasonal employment and local food availability. The present dataset cannot disentangle these pathways, but the divergence highlights the importance of examining household food conditions through multiple dimensions rather than income alone.
The dietary-diversity findings reinforce this point. The median
exploratory DDS was four in both blocks, despite a statistically
significant difference in the overall distributions. The mean DDS was
slightly higher in Sundarpahari than in Littipara. Thus, the block with
the less favourable reported meal-frequency pattern did not have a
correspondingly lower central dietary-diversity score. A household
may consume fewer meals while maintaining a relatively varied
selection of foods within those meals.
These findings are also compatible with evidence from Pahariya
populations indicating the importance of indigenous foods,
agroforestry and locally available food resources in shaping dietary
diversity and nutritional outcomes (Ghosh-Jerath et al., 2020; Ghosh-
Jerath et al., 2021a) [6,7]. Environmental and climate-related changes
may also influence agroforestry systems, food consumption patterns
and dietary diversity among indigenous subsistence farmers (Ghosh-
Jerath et al., 2021b) [8]. The present findings add that household meal
frequency and dietary diversity may not necessarily move in parallel.
Because the DDS used here was an exploratory measure based on
the food groups represented in the questionnaire rather than a fully
validated dietary assessment instrument, it should be interpreted as
indicative rather than definitive.
Nutrition gardens, productive assets and household capabilities:
Nutrition-garden maintenance was substantially more common
in Littipara than in Sundarpahari, and the difference remained
evident after adjustment for household income, livelihood
diversification, financial inclusion, savings, livestock ownership
and adult literacy. Nutrition gardens can potentially link household
production with access to vegetables and other nutrient-rich foods.
Nutrition-sensitive agriculture literature similarly emphasises that
agricultural interventions are more likely to contribute to nutrition
when pathways between production, household food access and
dietary choices are explicitly considered (Ruel & Alderman, 2013;
Ruel et al., 2018) [1,3].The positive adjusted associations of SHG membership, current savings, livestock ownership and adult literacy with nutritiongarden maintenance are particularly informative. Taken together, these variables suggest that garden maintenance may form part of a wider cluster of household capabilities. Households with some financial liquidity, productive assets, institutional participation and human capital may be better positioned to establish and maintain household food-production systems. This interpretation is consistent with livelihood approaches that view resilience as dependent on interactions among multiple forms of capital rather than on a single asset (Chambers & Conway, 1992; Scoones, 1998) [9,14].
The positive association between adult literacy and both nutritiongarden maintenance and dietary diversity is also noteworthy. Literacy may facilitate access to information, engagement with public programmes, understanding of agricultural or nutrition messages and interaction with formal institutions. However, because the study is cross-sectional, literacy should not be interpreted as a causal determinant. It may instead be a marker of broader household human capital and institutional engagement.
The inverse association between reported household income and nutrition-garden maintenance was unexpected. One possible interpretation is that households with greater cash income may rely more heavily on purchased foods and therefore have less incentive or available labour to maintain household gardens. Another possibility is that income acts as a proxy for livelihood composition, market dependence or other unmeasured characteristics. Reverse causation is also possible because income and garden status were measured at the same point in time. This finding should therefore be regarded as hypothesis-generating rather than as evidence that higher income reduces garden maintenance.
The absence of a significant association between the exploratory
LDS and nutrition-garden maintenance further reinforces the
limitations of a simple activity-count measure. A household may
engage in several livelihood activities without necessarily possessing
the labour, land, water or financial resources required for household
food production. Conversely, a household with fewer livelihood
categories may have a more productive or stable livelihood portfolio.
Interrelationship between livelihood resources and food-related outcomes:
The bivariate findings provide additional evidence that household
livelihood characteristics do not operate independently. Nutritiongarden
maintenance was associated with SHG membership, livestock
ownership and adult literacy, while lower meal frequency was
associated with livestock ownership, nutrition-garden status and
adult literacy. However, SHG membership and positive savings status
were not significantly associated with lower meal frequency at the
bivariate level. The DDS analysis similarly showed that nutritiongarden
maintenance and adult literacy were associated with a
one-point difference in median DDS, whereas SHG membership,
positive savings and livestock ownership were not associated with a
statistically significant difference in median DDS.These patterns suggest that different components of the livelihood system may relate to different dimensions of household food conditions. Institutional participation, financial liquidity, productive assets and human capital may support household resilience, but their observable relationships with food-related indicators may depend on the outcome considered.
The income-correlation analysis provides further evidence against
a simple linear livelihood–income relationship. Correlations between
household income and earning members, cultivable land and current
savings were very weak, while the strongest observed association, with
irrigated land, remained weak and inverse. The absence of significant
correlations between income and livestock ownership or employment
man-days further demonstrates that no single productive asset or
labour indicator adequately captured variation in reported household
income. These findings are consistent with livelihood perspectives that
conceptualise rural livelihood strategies as dynamic combinations of
assets and activities rather than isolated determinants of household
welfare (Ellis, 2000; Scoones, 2009) [10,15].
Taken together, the findings suggest that household livelihood security operates through interacting forms of capital rather than through a single economic indicator. Productive assets may support food production and subsistence, financial resources may provide liquidity, SHGs may provide institutional and social support, and literacy may facilitate access to information and services. These resources do not necessarily translate uniformly into income, dietary diversity or meal frequency. The contrasting patterns observed between the two blocks therefore suggest that the relationship between livelihood resources and food-related conditions is context-dependent and may involve multiple pathways operating simultaneously.
Taken together, the findings suggest that household livelihood security operates through interacting forms of capital rather than through a single economic indicator. Productive assets may support food production and subsistence, financial resources may provide liquidity, SHGs may provide institutional and social support, and literacy may facilitate access to information and services. These resources do not necessarily translate uniformly into income, dietary diversity or meal frequency. The contrasting patterns observed between the two blocks therefore suggest that the relationship between livelihood resources and food-related conditions is context-dependent and may involve multiple pathways operating simultaneously.
Strong contextual effects and implications for PVTG programming:
212. The very large adjusted association between Sundarpahari
and reporting two or fewer meals per day deserves particular
attention. The AOR of 42.33 is consistent with the pronounced
separation already evident in the descriptive distribution. However,
the coefficient should not be interpreted as an effect of geographic
residence itself. Study block is likely to capture multiple contextual
characteristics—including livelihood systems, ecological conditions,
food availability, employment opportunities, infrastructure, market
access and programme context—that were not fully represented in
the regression model.Similarly, the adjusted odds ratio of 0.30 for nutrition-garden maintenance among Sundarpahari households indicates strong contextual differences in garden maintenance, but does not establish that location itself prevents households from maintaining gardens. The two findings together point towards the importance of placespecific programming within PVTG communities. A common intervention package may require different implementation strategies depending on the local combination of land access, water availability, livelihood opportunities, household assets, institutional participation and food environment.
The findings have implications for nutrition-sensitive livelihood programming among Pahariya communities. First, interventions should not rely solely on household income as an indicator of economic well-being. Productive assets, savings, food-production capacity and the stability and composition of livelihoods should also be considered. Second, financial inclusion programmes should move beyond account opening towards meaningful savings mobilisation, access to appropriate financial services and productive use of financial resources. Third, nutrition gardens may be more effective when integrated with SHGs, livestock interventions, water access, agricultural support and nutrition education rather than promoted as a stand-alone activity.
Such integrated approaches are consistent with nutrition sensitive
agriculture principles that seek to strengthen pathways
between agriculture, livelihoods and dietary outcomes (Kadiyala et
al., 2014; Ruel et al., 2018; FAO, 2023) [2,3,16].
The findings are also relevant in the context of targeted government programmes for PVTGs. The Pradhan Mantri Janjati Adivasi Nyaya Maha Abhiyan (PM-JANMAN) seeks to address multiple dimensions of deprivation among Particularly Vulnerable Tribal Groups, including housing, water, livelihoods, health and access to basic services (Ministry of Tribal Affairs, Government of India, 2024) [17]. The present findings suggest that such convergence is particularly important because household vulnerability in these communities is multidimensional rather than reducible to income or a single sectoral indicator.
The findings are also relevant in the context of targeted government programmes for PVTGs. The Pradhan Mantri Janjati Adivasi Nyaya Maha Abhiyan (PM-JANMAN) seeks to address multiple dimensions of deprivation among Particularly Vulnerable Tribal Groups, including housing, water, livelihoods, health and access to basic services (Ministry of Tribal Affairs, Government of India, 2024) [17]. The present findings suggest that such convergence is particularly important because household vulnerability in these communities is multidimensional rather than reducible to income or a single sectoral indicator.
Contribution of the study:
The contribution of this study lies in demonstrating that, within
a PVTG population sharing a broadly similar cultural and ecological
setting, household livelihood profiles and food-related conditions may
differ substantially across locations. The findings also demonstrate
the analytical value of examining income alongside productive assets,
savings, institutional participation and household food practices
rather than treating income as a sufficient proxy for household wellbeing.
The study therefore adds a context-sensitive household-level
perspective to the limited evidence base on livelihood and food related
conditions among Pahariya communities.Strengths and limitations:
This study has several strengths. It draws on a relatively large
household-level baseline dataset covering 993 Pahariya households
across two PVTG-dominated blocks. The analysis combines
demographic characteristics with livelihood resources, financial
inclusion, savings, productive assets, nutrition-garden maintenance
and household food-related indicators. The inclusion of bivariate and
exploratory multivariable analyses permits examination of whether
selected associations persist after adjustment for other measured
household characteristics.Several limitations should be considered. First, the cross-sectional design prevents conclusions regarding causality or temporal ordering; observed associations may reflect reverse causation, confounding or common underlying factors. Second, several variables were household-reported and may be subject to recall or reporting bias, particularly income and meal frequency. Third, meal frequency should not be interpreted as a validated measure of household food insecurity. Fourth, the DDS was exploratory, based on the food groups available in the questionnaire, and should not be equated with a validated dietary-diversity or individual dietary-adequacy instrument. It also does not capture individual intake or intra-household food allocation. The nutrition-garden model also showed evidence of imperfect calibration on the Hosmer–Lemeshow test; this further supports interpreting the model as exploratory rather than predictive. Fifth, the reported malnourishment indicator was available only for households to which the question was applicable and was based on household reporting rather than independently measured anthropometry; the reported proportions therefore cannot be interpreted as anthropometric prevalence estimates.
Sixth, the LDS captured the number of livelihood categories but did not incorporate their income contribution, seasonality, profitability, stability or food contribution. Seventh, income estimates in seasonal and partly subsistence livelihoods may be difficult to measure accurately. Eighth, the study was restricted to two PVTGdominated intervention settings, limiting generalisability to other Pahariya households or PVTG communities. Finally, the strong block- level associations indicate that important contextual variables may remain unmeasured, resulting in residual confounding.
Despite these limitations, the study provides useful baseline evidence on the multidimensional nature of livelihood and foodrelated vulnerability among Pahariya households. The findings indicate that livelihood resources, financial capacity, institutional participation, human capital and household food practices may interact in complex ways, and that substantial differences may exist between geographically distinct PVTG populations even within the same broader cultural group.
Conclusion
Pahariya households in Littipara and Sundarpahari showed
substantially different livelihood, asset and food-related profiles
despite sharing a broader PVTG and socio-cultural context. Littipara
households generally had more earning members, cultivable land,
livestock, savings, nutrition-garden maintenance and adult literacy,
whereas Sundarpahari households reported higher median annual
income but markedly different meal-frequency patterns and lower
levels of several productive resources. These findings indicate that
household economic position cannot be adequately characterised by
income alone.
Formal financial access was high in both settings, but savings differed, illustrating the distinction between access to financial institutions and effective financial capacity. Nutrition-garden maintenance was positively associated with SHG membership, savings, livestock ownership and adult literacy, while lower reported meal frequency was strongly associated with the Sundarpahari context and inversely associated with income and adult literacy. Meal frequency and exploratory dietary diversity did not show parallel patterns, reinforcing the value of using multiple food-related indicators.
The findings support integrated, context-specific and nutritionsensitive livelihood programming for Pahariya and other PVTG communities, combining productive assets, savings and financial capability, community institutions, nutrition gardens, livestock and agricultural support, water access and human-capital development. These associations should not be interpreted causally. Longitudinal studies using validated dietary assessments, anthropometric measures and more detailed indicators of livelihood composition, seasonality and food access are needed to clarify the pathways linking livelihood systems with household food and nutrition-related conditions.
Acknowledgements
The author gratefully acknowledges Sarva Seva Samity Sanstha (4S
India) for providing the institutional platform and support that made
this work possible. The author sincerely acknowledges Tata Trusts
for supporting the PAHCHAN project, from which the baseline data
for this study were drawn, and Paul Hamlyn Foundation (PHF) for
its valuable support to the community-focused interventions in the
study area.
Special appreciation is extended to Mr. Mihir Sahana, Executive Director, 4S India, for providing the opportunity to undertake this work and for his continued encouragement, and to Ms. Muhua Sengupta and Kumar Gaurav for their valuable guidance, insights and support throughout the process.
The author sincerely appreciates the dedicated field team for their relentless efforts, commitment and perseverance in undertaking fieldwork and data collection across challenging terrain and under demanding field conditions. Above all, heartfelt gratitude is extended to the Pahariya community and participating households, whose simplicity, trust, resilience and cooperation made this study possible. Their strength and perseverance remain a lasting source of inspiration and are central to the successful completion of this work.
References
Citation
Chakraborty D. Livelihood Diversification, Financial Inclusion and Food and Nutrition-Related Indicators among Pahariya Households in Two PVTG-Dominated Blocks of Jharkhand, India: Evidence from a Cross-Sectional Baseline Survey. J Environ Soc Sci. 2026;11(1): 137.